Radio Shack 2013 Annual Report Download - page 49
Download and view the complete annual report
Please find page 49 of the 2013 Radio Shack annual report below. You can navigate through the pages in the report by either clicking on the pages listed below, or by using the keyword search tool below to find specific information within the annual report.-
 1
1 -
2
-
3
-
4
-
5
-
6
-
7
-
8
-
9
-
10
-
11
-
12
-
13
-
14
-
15
-
16
-
17
-
18
-
19
-
20
-
21
-
22
-
23
-
24
-
25
-
26
-
27
-
28
-
29
-
30
-
31
-
32
-
33
-
34
-
35
-
36
-
37
-
38
-
 39
39 -
 40
40 -
 41
41 -
 42
42 -
 43
43 -
 44
44 -
 45
45 -
 46
46 -
 47
47 -
 48
48 -
 49
49 -
 50
50 -
 51
51 -
 52
52 -
 53
53 -
 54
54 -
 55
55 -
 56
56 -
 57
57 -
 58
58 -
 59
59 -
60
-
61
-
62
-
63
-
64
-
65
-
66
-
67
-
68
-
69
-
70
-
71
-
72
-
73
-
74
-
75
-
76
-
77
-
78
-
79
-
80
 |
 |

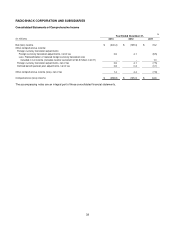
47
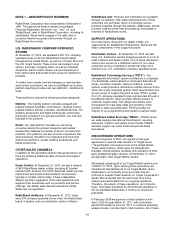
Discontinued Operations: We account for closed retail
locations as discontinued operations when the operations
and cash flows of a retail location being disposed of are
eliminated from ongoing operations and we do not have
any significant continuing involvement in its operations. In
reaching the determination as to whether the cash flows of
a retail location will be eliminated from our ongoing
operations, we consider whether it is likely that customers
will migrate to our other retail locations in the same
geographic market.
Reclassifications: Certain amounts in the December 31,
2012 and 2011, financial statements have been reclassified
to conform to the December 31, 2013, presentation. These
reclassifications had no effect on net income, total assets,
total liabilities, or total stockholders’ equity as previously
reported.
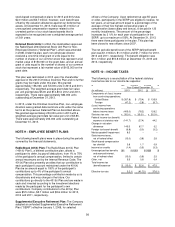
NOTE 3 – SUPPLEMENTAL BALANCE SHEET
DISCLOSURES
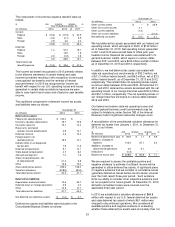
Accounts and Notes Receivable, Net: As of December
31, 2013 and 2012, we had the following accounts and
notes receivable outstanding in the accompanying
Consolidated Balance Sheets:
December 31,
(In millions) 2013 2012
Receivables from vendors
and service providers, net
$
144.2
$ 315.3
Trade accounts receivable 37.0
49.9
Income tax receivable 9.8
64.4
Other receivables 22.3
24.1
Allowance for doubtful accounts (1.4)
(1.2)
Accounts and notes receivable, net
$
211.9
$ 452.5
Receivables from vendors and service providers relate to
earned wireless activation commissions, rebates, residual
income, promotions, marketing development funds and
other payments from our third-party service providers and
product vendors, after taking into account estimates for
service providers’ customer deactivations and non-
activations, which are factors in determining the amount of
wireless activation commissions and residual income
earned. The decrease in our receivables from vendors and
service providers in 2013 was driven by the decrease in our
postpaid wireless business and the timing of payments
received from our service providers.
The change in the allowance for doubtful accounts is as
follows:
December 31,
(In millions) 2013 2012
2011
Beginning of year $ 1.2 $ 1.4
$
1.4
Provision for bad debts
included in selling,
general and
administrative expense 0.2 0.1 0.1
Uncollected receivables
written off, net -- (0.3) (0.1)
End of year $ 1.4 $ 1.2
$
1.4
Other Current Assets, Net:
December 31,
(In millions) 2013 2012
Restricted cash $ 66.0
$ 26.5
Prepaid rent 22.5
1.3
Deferred income taxes --
23.9
Other 50.5
33.7
Total other current assets, net $ 139.0
$ 85.4
The increase in restricted cash in 2013 was required in
connection with the closing of our asset-based revolving
credit facility that expires in December 2018. Since
December 31, 2013, substantially all of these letters of
credit have either expired or have been issued under our
asset-based revolving credit facility.
Property, Plant and Equipment, Net:
December 31,
(In millions) 2013 2012
Land $ 2.4
$ 2.5
Buildings 61.4
62.9
Furniture, fixtures, equipment
and software 672.5
685.9
Leasehold improvements 349.8
355.7
Total PP&E 1,086.1
1,107.0
Less accumulated depreciation
and amortization (898.9)
(868.0)
Property, plant and equipment, net $ 187.2
$ 239.0
Other Assets, Net:
December 31,
(In millions) 2013 2012
Deferred credit facility fees $ 21.6
$ 1.7
Notes receivable 10.4
12.2
Deferred debt issuance costs 8.8
10.0
Other 17.5
17.7
Total other assets, net $ 58.3
$ 41.6
Accrued Expenses and Other Current Liabilities:
December 31,
(In millions) 2013 2012
Insurance $ 62.5
$ 58.7
Sales and payroll taxes 28.3
41.6
Payroll and bonuses 28.1
49.5
Gift card deferred revenue 23.4
21.9
Advertising 5.7
21.6
Other 59.1
70.6
Total accrued expenses and
other current liabilities $ 207.1
$ 263.9
Other Non-Current Liabilities:
December 31,
(In millions) 2013 2012
Liability for unrecognized tax benefits $ 122.8
$ 135.8
Deferred compensation 23.5
27.0
Deferred rent 22.9
24.7
Deferred income taxes --
21.2
Other 18.0
14.5
Total other non-current liabilities $ 187.2
$ 223.2