Radio Shack 2013 Annual Report Download - page 57
Download and view the complete annual report
Please find page 57 of the 2013 Radio Shack annual report below. You can navigate through the pages in the report by either clicking on the pages listed below, or by using the keyword search tool below to find specific information within the annual report.-
 1
1 -
2
-
3
-
4
-
5
-
6
-
7
-
8
-
9
-
10
-
11
-
12
-
13
-
14
-
15
-
16
-
17
-
18
-
19
-
20
-
21
-
22
-
23
-
24
-
25
-
26
-
27
-
28
-
29
-
30
-
31
-
32
-
33
-
34
-
35
-
36
-
37
-
38
-
39
-
40
-
41
-
42
-
43
-
44
-
45
-
46
-
 47
47 -
 48
48 -
 49
49 -
 50
50 -
 51
51 -
 52
52 -
 53
53 -
 54
54 -
 55
55 -
 56
56 -
 57
57 -
 58
58 -
 59
59 -
 60
60 -
 61
61 -
 62
62 -
 63
63 -
 64
64 -
 65
65 -
 66
66 -
 67
67 -
68
-
69
-
70
-
71
-
72
-
73
-
74
-
75
-
76
-
77
-
78
-
79
-
80
 |
 |

55
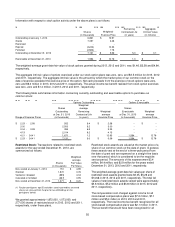
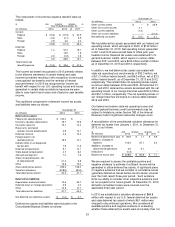
Information with respect to stock option activity under the above plans is as follows:
Remaining Aggregate
Shares Weighted-
average
Contractual Life Intrinsic Value
(in thousands) Exercise Price (in years) (in millions)
Outstanding at January 1, 2013 6,861 $ 13.97
Grants 7,097 3.48
Exercised -- --
Expired (4,244) 14.33
Forfeited (2,583) 7.78
Outstanding at December 31, 2013 7,131 $
5.56 5.0 $
0.1
Exercisable at December 31, 2013 1,594 $
12.76 1.0 $
--
The weighted-average grant-date fair value of stock options granted during 2013, 2012 and 2011, was $1.46, $2.38 and $4.84,
respectively.
The aggregate intrinsic value of options exercised under our stock option plans was zero, zero, and $3.5 million for 2013, 2012
and 2011, respectively. The aggregate intrinsic value is the amount by which the market price of our common stock on the
date of exercise exceeded the exercise price of the option. Net cash proceeds from the exercise of stock options were zero,
zero and $6.0 million in 2013, 2012 and 2011, respectively. The actual income tax benefit realized from stock option exercises
was zero, zero and $1.4 million, in 2013, 2012 and 2011, respectively.
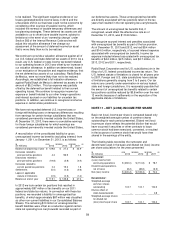
The following table summarizes information concerning currently outstanding and exercisable options to purchase our
common stock:
Options Outstanding Options Exercisable
Weighted-
Shares average Shares
Outstanding Remaining Weighted- Exercisable Weighted-
at Dec. 31, 2013 Contractual Life average at Dec. 31, 2013 average
Range of Exercise Prices (in thousands) (in years) Exercise Price (in thousands) Exercise Price
$ 2.23 -
2.95 552
6.4 $ 2.58 -- $ --
3.00 2,500
6.2 3.00 -- --
3.04 -
3.93 394
6.3 3.23 -- --
4.13 2,014
6.2 4.13 -- --
4.21 -
24.41 1,671
1.2 12.63 1,594 12.76
$ 2.23 -
24.41 7,131
5.0 $ 5.56 1,594 $ 12.76
Restricted Stock: Transactions related to restricted stock
awards for the year ended December 31, 2013, are
summarized as follows:
Weighted-
average
Shares
Fair Value
(in thousands)
Per Share
Non-vested at January 1, 2013 751 $ 4.99
Granted 1,872 3.05
Vested or released (885) 4.04
Canceled or forfeited (367) 3.95
Non-vested at December 31, 2013 1,371 $ 3.20
(1)
For plan participants age 55 and older, certain granted but unvested
shares are released from the plan for tax withholdings on the
participants’ behalf.
We granted approximately 1,872,000, 1,073,000, and
277,000 shares of restricted stock in 2013, 2012 and 2011,
respectively, under these plans.
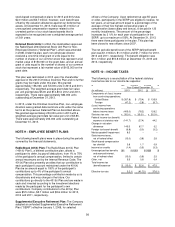
Restricted stock awards are valued at the market price of a
share of our common stock on the date of grant. In general,
these awards vest at the end of a three-year period from
the date of grant and are expensed on a straight-line basis
over that period, which is considered to be the requisite
service period. The amounts of this expense were $3.4
million, $4.4 million, and $2.9 million for the years ended
December 31, 2013, 2012 and 2011, respectively.
The weighted-average grant-date fair values per share of
restricted stock awards granted were $3.05, $5.26 and
$14.68 in 2013, 2012 and 2011, respectively. The total fair
values of restricted stock awards vested were approximately
$3.6 million, $5.2 million and $3.8 million in 2013, 2012 and
2011, respectively.
The compensation cost charged against income for all
stock-based compensation plans was $7.2 million, $7.1
million and $5.4 million in 2013, 2012 and 2011,
respectively. The total income tax benefit recognized for all
stock-based compensation plans was $2.1 million in 2011.
The tax benefit that would have been recognized for all