Radio Shack 2013 Annual Report Download - page 29
Download and view the complete annual report
Please find page 29 of the 2013 Radio Shack annual report below. You can navigate through the pages in the report by either clicking on the pages listed below, or by using the keyword search tool below to find specific information within the annual report.-
 1
1 -
2
-
3
-
4
-
5
-
6
-
7
-
8
-
9
-
10
-
11
-
12
-
13
-
14
-
15
-
16
-
17
-
18
-
 19
19 -
 20
20 -
 21
21 -
 22
22 -
 23
23 -
 24
24 -
 25
25 -
 26
26 -
 27
27 -
 28
28 -
 29
29 -
 30
30 -
 31
31 -
 32
32 -
 33
33 -
 34
34 -
 35
35 -
 36
36 -
 37
37 -
 38
38 -
 39
39 -
40
-
41
-
42
-
43
-
44
-
45
-
46
-
47
-
48
-
49
-
50
-
51
-
52
-
53
-
54
-
55
-
56
-
57
-
58
-
59
-
60
-
61
-
62
-
63
-
64
-
65
-
66
-
67
-
68
-
69
-
70
-
71
-
72
-
73
-
74
-
75
-
76
-
77
-
78
-
79
-
80
 |
 |
27
capital expenditures are discretionary and, therefore, may
not be spent if we decide not to pursue one or more of our
strategic initiatives. We estimate that our capital
expenditures for 2014 will be approximately $50 million
based on our operating performance during the year. U.S.
RadioShack company-operated store remodels and
relocations and information systems projects will account
for the majority of our anticipated 2014 capital
expenditures. The funding required for capital expenditures
will be from cash and cash equivalents, any cash generated
from operating activities, and our 2018 Credit Facility.
Restricted Cash: Restricted cash totaled $66.0 million at
December 31, 2013, and is included in other current assets
in our Consolidated Balance Sheets. This cash is pledged
as collateral for standby and trade letters of credit. We were
required to pledge this cash as collateral in connection with
the closing of our 2018 Credit Agreement. Subsequent to
December 31, 2013, we have withdrawn this cash and have
provided letters of credit issued under our 2018 Credit
Facility for a portion of the withdrawn cash.
Seasonal Inventory Buildup: Our expected annual cash
requirements for pre-seasonal inventory buildup from
August to November range between $100 million and $150
million. The funding required for this buildup will be from
cash and cash equivalents, any cash generated from
operating activities, and our 2018 Credit Facility.
Operating Leases: We use operating leases, primarily for
our retail locations and our corporate campus, to lower our
capital requirements.
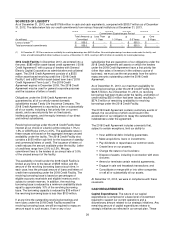
Contractual Obligations
The table below contains our known contractual commitments as of December 31, 2013.
Payments Due by Period
Less Than
More than
(In millions) Total
1 Year
1-3 Years
3-5 Years
5 Years
Long
-
term debt obligations
(1)
$
626.4
$ 1.1 $ 0.3 $ 300.0
$ 325.0
Interest obligations
272.4
53.7 106.0 104.5
8.2
Operating lease obligations
(2)
588.9
200.4 253.5 96.8
38.2
Purchase obligations
(3)
260.5
255.2 5.3 --
--
Other long
-
term liabilities reflected on the balance sheet
(4)
152.8
-- 21.7 7.7
123.4
Total contractual commitments $
1,901.0
$ 510.4 $ 386.8 $ 509.0
$ 494.8
(1) For more information regarding long-term debt, refer to Note 5 – “Indebtedness and Borrowing Facilities” of our Notes to Consolidated Financial Statements
included elsewhere in this Annual Report on Form 10-K.
(2) For more information regarding lease commitments, refer to Note 13 – “Commitments and Contingencies” of our Notes to Consolidated Financial Statements
included elsewhere in this Annual Report on Form 10-K.
(3) Purchase obligations primarily include our product commitments and marketing agreements.
(4) These long-term liabilities reflected on our Consolidated Balance Sheet represent contractual obligations for which we could reasonably estimate the timing of
cash payments. The remaining non-current liabilities reflected on our Consolidated Balance Sheet did not represent contractual obligations for future cash
payments.
In 2013 we entered into a $50 million secured term loan
and a $250 million secured term loan. Both of these loans
are due in December 2018. In connection with these
borrowings, we repaid $175 million aggregate principal
amount of existing secured term loans. Additionally, we
repaid the remaining $286.9 million of our 2.5% convertible
notes in 2013. For more information regarding our long-term
debt, refer to Note 5 – “Indebtedness and Borrowing
Facilities” of our Notes to Consolidated Financial Statements
included elsewhere in this Annual Report on Form 10-K.
Capitalization
The declaration of dividends, the dividend rate, and the
amount and timing of share repurchases are at the sole
discretion of our Board of Directors, and plans for future
dividends and share repurchases may be revised by the
Board of Directors at any time. We did not pay any
dividends during 2013. We do not currently intend to pay
dividends in the foreseeable future.
The following table sets forth information about our
capitalization on the dates indicated.
December 31,
2013
2012
% of
% of
(Dollars in millions) Dollars
Total
Dollars
Total
Short-term debt
$
1.1
0.1 %
$ 278.7
20.2 %
Long-term debt 613.0
74.7
499.0
36.3
Total debt 614.1
74.8
777.7
56.5
Stockholders'
equity 206.4
25.2
598.7
43.5
Total capitalization
$
820.5
100.0 %
$ 1,376.4
100.0 %
Dividends: We paid a dividend of $0.125 per share in the
first and second quarters of 2012 and an annual dividend of
$0.50 per share in 2011. Our dividend payments totaled
$24.9 million and $49.6 million in 2012 and 2011,
respectively, and were funded from cash on hand. On July
25, 2012, we announced that we were suspending our
dividend.
2011 Share Repurchase Program: In October 2011 our
Board of Directors approved a share repurchase program
with no expiration date authorizing management to
repurchase up to $200 million of our common stock to be