Radio Shack 2013 Annual Report Download - page 61
Download and view the complete annual report
Please find page 61 of the 2013 Radio Shack annual report below. You can navigate through the pages in the report by either clicking on the pages listed below, or by using the keyword search tool below to find specific information within the annual report.-
 1
1 -
2
-
3
-
4
-
5
-
6
-
7
-
8
-
9
-
10
-
11
-
12
-
13
-
14
-
15
-
16
-
17
-
18
-
19
-
20
-
21
-
22
-
23
-
24
-
25
-
26
-
27
-
28
-
29
-
30
-
31
-
32
-
33
-
34
-
35
-
36
-
37
-
38
-
39
-
40
-
41
-
42
-
43
-
44
-
45
-
46
-
47
-
48
-
49
-
50
-
 51
51 -
 52
52 -
 53
53 -
 54
54 -
 55
55 -
 56
56 -
 57
57 -
 58
58 -
 59
59 -
 60
60 -
 61
61 -
 62
62 -
 63
63 -
 64
64 -
 65
65 -
 66
66 -
 67
67 -
 68
68 -
 69
69 -
 70
70 -
 71
71 -
72
-
73
-
74
-
75
-
76
-
77
-
78
-
79
-
80
 |
 |

59
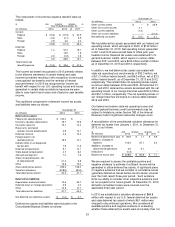
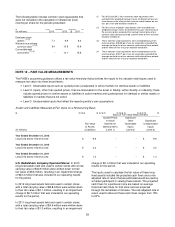
The following table includes common stock equivalents that
were not included in the calculation of diluted net (loss)
income per share for the periods presented:
(In millions) 2013 2012
2011
Employee stock
options
(1) (2)
7.1 6.9 6.3
Warrants to purchase
common stock
(1) (3)
8.4 15.8 15.8
Convertible debt
instruments
(1) (4)
-- 12.1 15.8
(1) For 2013 and 2012, these common stock equivalents were
excluded from weighted-average shares for diluted net loss per
share because the effect of their inclusion would reduce our net
loss per share and would be antidilutive.
(2) For 2011 these employee stock options were excluded from
weighted-average shares for diluted net loss per share because
the exercise prices exceeded the average market price of our
common stock during the period, and the effect of their inclusion
would be antidilutive.
(3) These common stock equivalents were excluded because the
exercise prices ($35.88 per share for all periods) exceeded the
average market price of our common stock during these periods,
and the effect of their inclusion would be antidilutive.
(4) These common stock equivalents were excluded because the
exercise prices ($23.77 per share for all periods) exceeded the
average market price of our common stock during these periods,
and the effect of their inclusion would be antidilutive.
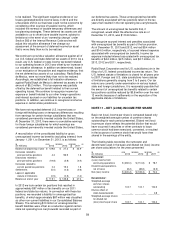
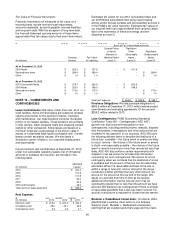
NOTE 12 – FAIR VALUE MEASUREMENTS
The FASB’s accounting guidance utilizes a fair value hierarchy that prioritizes the inputs to the valuation techniques used to
measure fair value into three broad levels:
• Level 1: Observable inputs such as quoted prices (unadjusted) in active markets for identical assets or liabilities
• Level 2: Inputs, other than quoted prices, that are observable for the asset or liability, either directly or indirectly; these
include quoted prices for similar assets or liabilities in active markets and quoted prices for identical or similar assets or
liabilities in markets that are not active
• Level 3: Unobservable inputs that reflect the reporting entity’s own assumptions
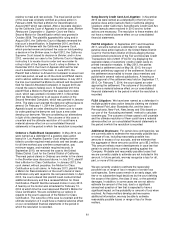
Assets and Liabilities Measured at Fair Value on a Nonrecurring Basis
Basis of Fair Value Measurements
Quoted Prices Significant
in Active Other Significant
Fair Value Markets for Observable Unobservable
of Assets Identical Items Inputs Inputs
(In millions) (Liabilities) (Level 1) (Level 2) (Level 3)
Year Ended December 31, 2013
Long-lived assets held and used $ 9.6
--
-- $ 9.6
Year Ended December 31, 2012
Long-lived assets held and used $ 3.2
--
-- $ 3.2
Year Ended December 31, 2011
Long-lived assets held and used $ 1.3
--
-- $ 1.3
U.S. RadioShack Company-Operated Stores: In 2013
long-lived assets held and used in certain stores with a total
carrying value of $32.9 million were written down to their
fair value of $9.6 million, resulting in an impairment charge
of $23.3 million that was included in our operating results
for the period.
In 2012 long-lived assets held and used in certain stores
with a total carrying value of $8.8 million were written down
to their fair value of $2.1 million, resulting in an impairment
charge of $6.7 million that was included in our operating
results for the period.
In 2011 long-lived assets held and used in certain stores
with a total carrying value of $4.4 million were written down
to their fair value of $1.3 million, resulting in an impairment
charge of $3.1 million that was included in our operating
results for the period.
The inputs used to calculate the fair value of these long-
lived assets included the projected cash flows and a risk-
adjusted rate of return that we estimated would be used by
a market participant in valuing these assets. The projected
cash flows for a particular store are based on average
historical cash flows for that store and are projected
through the remainder of its lease. The risk-adjusted rate of
return used to discount these cash flows ranges from 15%
to 20%.