Radio Shack 2013 Annual Report Download - page 23
Download and view the complete annual report
Please find page 23 of the 2013 Radio Shack annual report below. You can navigate through the pages in the report by either clicking on the pages listed below, or by using the keyword search tool below to find specific information within the annual report.-
 1
1 -
2
-
3
-
4
-
5
-
6
-
7
-
8
-
9
-
10
-
11
-
12
-
 13
13 -
 14
14 -
 15
15 -
 16
16 -
 17
17 -
 18
18 -
 19
19 -
 20
20 -
 21
21 -
 22
22 -
 23
23 -
 24
24 -
 25
25 -
 26
26 -
 27
27 -
 28
28 -
 29
29 -
 30
30 -
 31
31 -
 32
32 -
 33
33 -
34
-
35
-
36
-
37
-
38
-
39
-
40
-
41
-
42
-
43
-
44
-
45
-
46
-
47
-
48
-
49
-
50
-
51
-
52
-
53
-
54
-
55
-
56
-
57
-
58
-
59
-
60
-
61
-
62
-
63
-
64
-
65
-
66
-
67
-
68
-
69
-
70
-
71
-
72
-
73
-
74
-
75
-
76
-
77
-
78
-
79
-
80
 |
 |

21
These platforms include the following product categories:
Mobility: The mobility platform includes postpaid and
prepaid wireless handsets, commissions, residual income,
prepaid wireless airtime, e-readers, and tablet devices. Our
wireless accessories and tablet accessories, which were
previously included in our signature platform, are now also
included in this platform.
Retail: Our retail platform includes our remaining
consumer electronics product categories and related
accessories; batteries and power products; and technical
products. This platform now also consists of products that
were previously included in our signature and consumer
electronics platforms, except wireless accessories and
tablet accessories, which are now included in the mobility
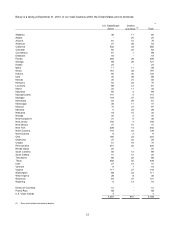
platform. The following table provides a summary of our
consolidated net sales and operating revenues by platform
and as a percent of net sales and operating revenues. Prior
period amounts have been reclassified to conform to our
current presentation.
Consolidated Net Sales and Operating Revenues
Year Ended December 31,
(In millions) 2013 2012 2011
Mobility
(1)
$ 1,799.7 52.4 % $ 2,008.6 52.4
% $ 2,014.8 50.0
%
Retail 1,612.2 46.9 1,794.0 46.8
1,992.1 49.4
Other sales
(2)
22.4 0.7 28.7 0.8
25.2 0.6
Consolidated net sales and operating revenues $ 3,434.3 100.0 % $ 3,831.3 100.0
% $ 4,032.1 100.0
%
(1) The aggregate amounts of upfront commission revenue and residual income received from wireless service providers and recorded in this platform were
$851.1 million, $1,029.6 million and $1,233.1 million for 2013, 2012 and 2011, respectively.
(2) Other sales include outside sales from repair services and outside sales of our global sourcing operations and domestic and overseas manufacturing
facilities. We closed our overseas manufacturing facility in June 2011.
U.S. RadioShack Company-Operated Stores Segment
The following table provides a summary of our net sales and operating revenues by platform and as a percent of net sales and
operating revenues for the U.S. RadioShack company-operated stores segment.
U.S. RadioShack Company-Operated Stores Segment
Net Sales and Operating Revenues
Year Ended December 31,
(In millions) 2013 2012 2011
Mobility $ 1,706.2 55.1 % $ 1,923.0 55.6
% $ 1,935.3 52.8
%
Retail 1,388.7 44.9 1,533.5 44.4
1,728.0 47.2
Net sales and operating revenues $ 3,094.9 100.0 % $ 3,456.5 100.0
% $ 3,663.3 100.0
%
Sales in our U.S. RadioShack company-operated stores
segment decreased $361.6 million or 10.5% in 2013. These
decreases in sales were driven by decreased sales in our
mobility and retail platforms. Additionally, we operated 98
fewer stores at December 31, 2013, than we did at
December 31, 2012, which contributed to a decrease in
consolidated sales and affected the sales results for each
platform discussed below.
Sales in our mobility platform (which includes postpaid and
prepaid wireless handsets, commissions and residual
income, prepaid wireless airtime, e-readers, tablet devices,
wireless accessories, and tablet accessories) decreased
11.3% in 2013. This decrease in sales was primarily driven
by decreased sales in our postpaid wireless business,
which were partially offset by increased sales in our prepaid
wireless business. Comparable store sales in this platform
decreased 9.0% in 2013.
The sales decrease in our postpaid wireless business was
driven by a decrease in the number of postpaid units sold,
which was partially offset by an increase in the average
revenue per unit sold. The decrease in the number of
postpaid wireless handsets sold was primarily driven by
decreased unit sales in our postpaid wireless business.
The increase in the average revenue per postpaid unit was
primarily driven by a change in our sales mix towards
higher-priced smartphones, which was partially offset by an
increase in commissions repaid to wireless service
providers related to wireless handset deactivations. See the
executive summary of this MD&A for further discussion of
these wireless handset deactivations.
Sales in our retail platform (which includes our remaining
consumer electronics product categories and related
accessories; batteries and power products; and technical
products) decreased 9.4% in 2013. This sales decrease
was primarily driven by decreased sales of laptop
computers, batteries, internet telephone devices, home
entertainment accessories, digital music players,
headphones, and GPS devices. These sales decreases
were partially offset by increased sales of portable
speakers and sales of Apple Lightning compatible cables
and adaptors. Comparable store sales in this platform
decreased 8.5% in 2013.
Other Sales
Amounts in other sales reflect our business activities that
are not separately reportable, including sales to our
independent dealers, sales generated by our Mexican
subsidiary and our www.radioshack.com website, sales to