Radio Shack 2013 Annual Report Download - page 27
Download and view the complete annual report
Please find page 27 of the 2013 Radio Shack annual report below. You can navigate through the pages in the report by either clicking on the pages listed below, or by using the keyword search tool below to find specific information within the annual report.-
 1
1 -
2
-
3
-
4
-
5
-
6
-
7
-
8
-
9
-
10
-
11
-
12
-
13
-
14
-
15
-
16
-
 17
17 -
 18
18 -
 19
19 -
 20
20 -
 21
21 -
 22
22 -
 23
23 -
 24
24 -
 25
25 -
 26
26 -
 27
27 -
 28
28 -
 29
29 -
 30
30 -
 31
31 -
 32
32 -
 33
33 -
 34
34 -
 35
35 -
 36
36 -
 37
37 -
38
-
39
-
40
-
41
-
42
-
43
-
44
-
45
-
46
-
47
-
48
-
49
-
50
-
51
-
52
-
53
-
54
-
55
-
56
-
57
-
58
-
59
-
60
-
61
-
62
-
63
-
64
-
65
-
66
-
67
-
68
-
69
-
70
-
71
-
72
-
73
-
74
-
75
-
76
-
77
-
78
-
79
-
80
 |
 |

25
The 2011 effective tax rate was affected by the realization
of job retention credits generated pursuant to the Hiring
Incentives to Restore Employment Act. These credits
lowered the effective tax rate by 1.0 percentage points.
RECENTLY ISSUED ACCOUNTING
PRONOUNCEMENTS
None.
LIQUIDITY AND CAPITAL RESOURCES
Cash Flow Overview
Operating Activities: Cash provided by operating activities
in 2013 was $35.8 million, compared with cash used in
operating activities of $43.0 million in 2012. Our cash flows
from operating activities are comprised of net loss plus non-
cash adjustments to net loss and the net changes in assets
and liabilities. The amounts of cash provided by net loss
plus non-cash adjustments to net loss were negative
$250.6 million and $59.9 million in 2013 and 2012,
respectively. The increase in net loss plus non-cash
adjustments was primarily driven by our increased net loss
in 2013.
The amount of cash provided by the net changes in assets
and liabilities was $286.4 million in 2013, compared with
cash used by the net changes in assets and liabilities of
$102.9 million in 2012. The increase in cash provided by
the net changes in assets and liabilities in 2013 was
primarily driven by cash provided by our decreased
accounts receivable and inventory balances at December
31, 2013. The decrease in our accounts receivable balance
in 2013 was driven by the decrease in our postpaid wireless
business and the collection of a tax refund in 2013. The
decrease in our inventory balance in 2013 was primarily
due to the discontinuation of our Target Mobile segment
and reduced inventories at our Mexican subsidiary.
Investing Activities: The amounts of cash used in
investing activities were $78.2 million and $94.2 million in
2013 and 2012, respectively. This decrease was driven by
decreased capital expenditures in 2013, which were
partially offset by an increase in our restricted cash
balance. For further discussion of our restricted cash, see
“Cash Requirements” later in this MD&A. Capital
expenditures were $42.3 million in 2013 compared with
$67.8 million in 2012. This decrease was a result of our
efforts to focus our capital spending on our U.S. stores to
high-impact, cost-efficient initiatives, as well as reduced
capital spending at our Mexican subsidiary related to fewer
new store openings in 2013. Capital expenditures primarily
related to our U.S. RadioShack company-operated stores
and information system projects in 2013 and 2012.
Financing Activities: Net cash used in financing activities
was $313.5 million in 2013 compared with net cash
provided by financing activities of $81.2 million in 2012. Our
net cash used in financing activities in 2013 was due to the
repayment of $461.9 million of long-term debt. This was
partially offset by $256.7 million in proceeds from the
issuance of long-term debt. Additionally, our changes in
cash overdrafts resulted in a $108.3 million use of cash.
Our net cash provided by financing activities in 2012 was
primarily due to the $175.0 million of new borrowings.
These borrowings were partially offset by the purchase of
$88.1 million principal amount of our 2013 convertible notes
and our dividend payments of $24.9 million.
Free Cash Flow: Our free cash flow, defined as cash flows
from operating activities less dividends paid and additions to
property, plant and equipment, was negative $6.5 million in
2013, negative $135.7 million in 2012, and $86.2 million in
2011. The increase in free cash flow for 2013 was
attributable to cash provided by the net changes in our
assets and liabilities described above.
We believe free cash flow is a relevant indicator of our
ability to repay maturing debt, change dividend payments or
fund other uses of capital that management believes will
enhance shareholder value. See “Liquidity Outlook” in the
executive summary of this MD&A for further discussion of
our sources of liquidity and our cash requirements in future
periods. The comparable financial measure to free cash
flow under generally accepted accounting principles is net
cash flows provided by or used in operating activities. Net
cash flows provided by operating activities was $35.8
million in 2013, compared with net cash used in operating
activities of $43.0 million in 2012 and cash provided by
operating activities of $217.9 million in 2011. We do not
intend for the presentation of free cash flow, a non-GAAP
financial measure, to be considered in isolation or as a
substitute for measures prepared in accordance with
GAAP, nor do we intend to imply that free cash flow
represents cash flow available for discretionary
expenditures.
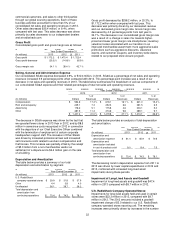
The following table is a reconciliation of cash flows from
operating activities to free cash flow.
Year Ended December 31,
(In millions) 2013 2012
2011
Net cash
provided by (used in)
operating activities $ 35.8 $
(43.0)
$ 217.9
Less:
Additions to property, plant
and equipment 42.3 67.8
82.1
Dividends paid -- 24.9
49.6
Free cash flow $
(6.5) $
(135.7)
$
86.2