Radio Shack 2013 Annual Report Download - page 65
Download and view the complete annual report
Please find page 65 of the 2013 Radio Shack annual report below. You can navigate through the pages in the report by either clicking on the pages listed below, or by using the keyword search tool below to find specific information within the annual report.-
 1
1 -
2
-
3
-
4
-
5
-
6
-
7
-
8
-
9
-
10
-
11
-
12
-
13
-
14
-
15
-
16
-
17
-
18
-
19
-
20
-
21
-
22
-
23
-
24
-
25
-
26
-
27
-
28
-
29
-
30
-
31
-
32
-
33
-
34
-
35
-
36
-
37
-
38
-
39
-
40
-
41
-
42
-
43
-
44
-
45
-
46
-
47
-
48
-
49
-
50
-
51
-
52
-
53
-
54
-
 55
55 -
 56
56 -
 57
57 -
 58
58 -
 59
59 -
 60
60 -
 61
61 -
 62
62 -
 63
63 -
 64
64 -
 65
65 -
 66
66 -
 67
67 -
 68
68 -
 69
69 -
 70
70 -
 71
71 -
 72
72 -
 73
73 -
 74
74 -
 75
75 -
76
-
77
-
78
-
79
-
80
 |
 |

63
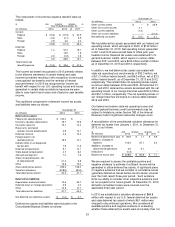
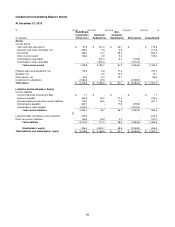
Depreciation and amortization by reportable segment is as follows:
Year Ended December 31,
(In millions) 2013 2012
2011
U.S. RadioShack company-operated stores $ 29.9 $ 31.8 $ 37.9
Other 4.4 3.8 4.0
34.3 35.6 41.9
Unallocated
(1)
36.1 38.7 36.2
Depreciation and amortization from continuing operations 70.4 74.3 78.1
Depreciation and amortization from discontinued operations 1.2 6.4 5.0
Total depreciation and amortization $ 71.6 $ 80.7 $ 83.1
(1) Depreciation and amortization included in the unallocated category primarily relate to our information technology assets.
Product Sales Information: Our consolidated net sales and operating revenues are summarized by groups of similar
products and services, as follows(prior period amounts have been reclassified to conform to our current presentation):
Consolidated Net Sales and Operating Revenues
Year Ended December 31,
(In millions) 2013 2012 2011
Mobility $ 1,799.7 52.4 % $ 2,008.6 52.4
% $ 2,014.8 50.0
%
Retail 1,612.2 46.9 1,794.0 46.8
1,992.1 49.4
Other sales
(1)
22.4 0.7 28.7 0.8
25.2 0.6
Consolidated net sales and
operating revenues $ 3,434.3 100.0 % $ 3,831.3 100.0
% $ 4,032.1 100.0
%
(1) Other sales include outside sales from repair services and outside sales of our global sourcing operations and domestic and overseas manufacturing
facilities. We closed our overseas manufacturing facility in June 2011.