Radio Shack 2013 Annual Report Download - page 26
Download and view the complete annual report
Please find page 26 of the 2013 Radio Shack annual report below. You can navigate through the pages in the report by either clicking on the pages listed below, or by using the keyword search tool below to find specific information within the annual report.-
 1
1 -
2
-
3
-
4
-
5
-
6
-
7
-
8
-
9
-
10
-
11
-
12
-
13
-
14
-
15
-
 16
16 -
 17
17 -
 18
18 -
 19
19 -
 20
20 -
 21
21 -
 22
22 -
 23
23 -
 24
24 -
 25
25 -
 26
26 -
 27
27 -
 28
28 -
 29
29 -
 30
30 -
 31
31 -
 32
32 -
 33
33 -
 34
34 -
 35
35 -
 36
36 -
37
-
38
-
39
-
40
-
41
-
42
-
43
-
44
-
45
-
46
-
47
-
48
-
49
-
50
-
51
-
52
-
53
-
54
-
55
-
56
-
57
-
58
-
59
-
60
-
61
-
62
-
63
-
64
-
65
-
66
-
67
-
68
-
69
-
70
-
71
-
72
-
73
-
74
-
75
-
76
-
77
-
78
-
79
-
80
 |
 |

24
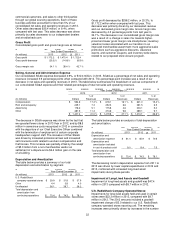
The decrease in gross profit dollars of the postpaid wireless
business in our U.S. RadioShack company-operated stores
was the result of decreases in 2012 in the number of units
sold and in the average gross profit dollars per unit sold,
when compared with 2011. Average gross profit dollars per
unit sold decreased because our average cost per unit
increased from last year at a higher rate than the increase
in our average revenue per unit. The increase in average
cost per unit was driven by the change in our sales mix
towards higher cost smartphones such as the Apple iPhone
and Android-based smartphones.
The decrease in our consolidated gross margin rate was a
result of the decrease in the gross margin rate of the
postpaid wireless business in our U.S. RadioShack
company-operated stores. The decrease in the gross
margin rate of our postpaid wireless business was driven by
a change in our sales mix towards lower-margin
smartphones and a decrease in the average gross profit
dollars per unit sold.
When excluding the postpaid wireless business, the gross
margin rate for the balance of our business was
comparable to 2011.
Selling, General and Administrative Expense
Our consolidated SG&A expense decreased 3.7%, or $54.9
million, in 2012. SG&A as a percentage of net sales and
operating revenues increased by 0.5 percentage points
when compared with 2011.
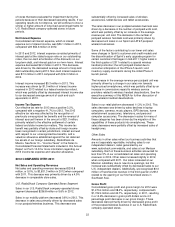
The decrease in SG&A expense was driven by decreased
advertising expense, decreased rent and occupancy
expense, and decreased compensation expense in the
second half of 2012. Additionally, SG&A in 2012 was lower
due to a one-time $23.4 million charge in 2011 related to
our transition from T-Mobile to Verizon and a one-time $9.5
million charge in 2011 related to the closure of our Chinese
manufacturing plant. These decreases were partially offset
by severance costs of $8.5 million in connection with the
departure of our Chief Executive Officer combined with the
termination of employment of certain corporate
headquarters support staff in the third quarter of 2012.
We announced on September 25, 2012, that our Board of
Directors and Mr. James F. Gooch had agreed that Mr.
Gooch would step down from his position as Chief
Executive Officer and as a director of the Company,
effective immediately. Under Mr. Gooch’s employment
agreement, he was entitled to a specified cash payment
and the accelerated vesting of certain stock awards. During
the third quarter ended September 30, 2012, we recorded
$5.6 million of employee separation charges in connection
with Mr. Gooch’s departure. This included a cash charge of
$4.0 million and a non-cash charge of $1.6 million related to
the accelerated vesting of stock awards.
During the third quarter ended September 30, 2012, we
recorded $2.9 million of employee separation charges in
connection with the termination of the employment of
approximately 150 employees, who worked primarily at our
corporate headquarters.
Depreciation and Amortization
Total depreciation and amortization from continuing
operations for 2012 declined $3.8 million or 4.9%.
Impairment of Long-Lived Assets and Goodwill
Impairment of long-lived assets and goodwill was $9.7
million in 2012 compared with $3.1 million in 2011.
U.S. RadioShack Company-Operated Stores:
Impairments for long-lived assets held and used in certain
stores were $6.7 million in 2012 compared with $3.1 million
in 2011. This increase was primarily driven by an increase
in the number of stores that were evaluated for impairment
throughout 2012 because of their decreased operating
results.
Goodwill Impairment: For the first half of 2012, we
experienced a significant decline in the market
capitalization of our common stock, which was driven
primarily by lower than expected operating results. Our
market capitalization was lower than our consolidated net
book value for much of this period. We determined that
these facts were an indicator that we should conduct an
interim goodwill impairment test in the third quarter.
After reviewing our reporting units, we determined that the
fair value of our U.S. RadioShack company-operated stores
reporting unit could not support its $3.0 million of goodwill
due to our lower market capitalization. This resulted in a
$3.0 million impairment charge that was included in our
operating results for the third quarter of 2012. Our U.S.
RadioShack company-operated stores reporting unit is
comprised of our U.S. RadioShack company-operated
stores operating segment, our overhead and corporate
expenses that are not allocated to our operating segments,
and all of our interest expense.
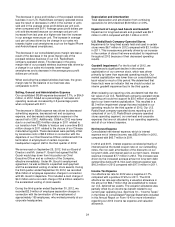
Net Interest Expense
Consolidated net interest expense, which is interest
expense net of interest income, was $52.6 million in 2012,
compared with $43.7 million in 2011.
In 2012 and 2011, interest expense consisted primarily of
interest paid at the stated coupon rate on our outstanding
notes, the non-cash amortization of the discounts on our
long-term debt, and interest paid on our term loans. Interest
expense increased $7.7 million in 2012. This increase was
driven by the increased average amount of long-term debt
outstanding during 2012. Non-cash interest expense was
$16.3 million in 2012 compared with $17.0 million in 2011.
Income Tax Expense
Our effective tax rate for 2012 was a negative 41.7%,
compared with a positive 37.6% for 2011. The 2012
effective tax rate was affected by a valuation allowance in
the amount of $62.7 million that we established to reduce
our U.S. deferred tax assets. The valuation allowance was
partially offset by an income tax benefit related to our
current year operating loss. See Note 10 – “Income Taxes”
in the Notes to Consolidated Financial Statements included
in this Annual Report on Form 10-K for more information
regarding our 2012 income tax expense and valuation
allowance.