Pizza Hut 2003 Annual Report Download - page 79
Download and view the complete annual report
Please find page 79 of the 2003 Pizza Hut annual report below. You can navigate through the pages in the report by either clicking on the pages listed below, or by using the keyword search tool below to find specific information within the annual report.-
 1
1 -
2
-
3
-
4
-
5
-
6
-
7
-
8
-
9
-
10
-
11
-
12
-
13
-
14
-
15
-
16
-
17
-
18
-
19
-
20
-
21
-
22
-
23
-
24
-
25
-
26
-
27
-
28
-
29
-
30
-
31
-
32
-
33
-
34
-
35
-
36
-
37
-
38
-
39
-
40
-
41
-
42
-
43
-
44
-
45
-
46
-
47
-
48
-
49
-
50
-
51
-
52
-
53
-
54
-
55
-
56
-
57
-
58
-
59
-
60
-
61
-
62
-
63
-
64
-
65
-
66
-
67
-
68
-
 69
69 -
 70
70 -
 71
71 -
 72
72 -
 73
73 -
 74
74 -
 75
75 -
 76
76 -
 77
77 -
 78
78 -
 79
79 -
 80
80 -
 81
81 -
 82
82 -
 83
83 -
 84
84
 |
 |

Yum! Brands Inc. 77.
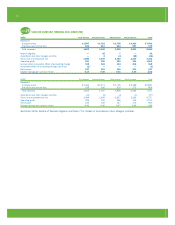
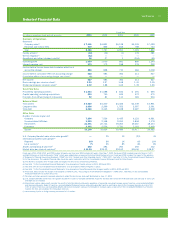
Selected Financial Data
Fiscal Year
(in millions, except per share and unit amounts) 2003 2002 2001 2000 1999
Summary of Operations
Revenues
Company sales(a) $ 7,441 $ 6,891 $ 6,138 $ 6,305 $ 7,099
Franchise and license fees 939 866 815 788 723
Total 8,380 7,757 6,953 7,093 7,822
Facility actions(b) (36) (32) (1) 176 381
Wrench litigation(c) (42) — — — —
AmeriServe and other (charges) credits(d) 26 27 3 (204) (51)
Operating profit 1,059 1,030 891 860 1,240
Interest expense, net 173 172 158 176 202
Income before income taxes and cumulative effective of
accounting change 886 858 733 684 1,038
Income before cumulative effect of accounting change 618 583 492 413 627
Cumulative effect of accounting change, net of tax(e) (1) — — — —
Net income 617 583 492 413 627
Basic earnings per common share(f) 2.10 1.97 1.68 1.41 2.05
Diluted earnings per common share(f) 2.02 1.88 1.62 1.39 1.96
Cash Flow Data
Provided by operating activities $ 1,053 $ 1,088 $ 832 $ 491 $ 565
Capital spending, excluding acquisitions 663 760 636 572 470
Proceeds from refranchising of restaurants 92 81 111 381 916
Balance Sheet
Total assets $ 5,620 $ 5,400 $ 4,425 $ 4,149 $ 3,961
Long-term debt 2,056 2,299 1,552 2,397 2,391
Total debt 2,066 2,445 2,248 2,487 2,508
Other Data
Number of stores at year end
Company 7,854 7,526 6,435 6,123 6,981
Unconsolidated Affiliates 1,512 2,148 2,000 1,844 1,178
Franchisees 21,471 20,724 19,263 19,287 18,414
Licensees 2,362 2,526 2,791 3,163 3,409
System 33,199 32,924 30,489 30,417 29,982
U.S. Company blended same store sales growth(g) — 2% 1% (2)% 4%
International system sales growth(h)
Reported 14% 8% 1% 6% 10%
Local currency(i) 7% 9% 8% 8% 8%
Shares outstanding at year end(f) 292 294 293 293 302
Market price per share at year end(f) $ 33.64 $ 24.12 $ 24.62 $ 16.50 $ 18.97
Fiscal years 2003, 2002, 2001 and 1999 include 52 weeks and fiscal year 2000 includes 53 weeks. From May 7, 2002, fiscal year 2002 included Long John Silver’s (“LJS”)
and A&W All-American Food Restaurants (“A&W”), which were added when we acquired Yorkshire Global Restaurants, Inc. Fiscal year 2002 includes the impact of the adoption
of Statement of Financial Accounting Standards (“SFAS”) No. 142, “Goodwill and Other Intangible Assets” (“SFAS 142”). See Note 12 to the Consolidated Financial Statements
for further discussion. The selected financial data should be read in conjunction with the Consolidated Financial Statements and the Notes thereto.
(a) The decline in Company sales through 2001 was largely the result of our refranchising initiatives.
(b) See Note 7 to the Consolidated Financial Statements for a description of Facility actions in 2003, 2002 and 2001.
(c) See Note 24 to the Consolidated Financial Statements for a description of Wrench litigation in 2003.
(d) See Note 7 to the Consolidated Financial Statements for a description of AmeriServe and other charges (credits) in 2003, 2002 and 2001.
(e) Fiscal year 2003 includes the impact of the adoption of SFAS No. 143, “Accounting for Asset Retirement Obligations” (“SFAS 143”). See Note 2 to the Consolidated
Financial Statements for further discussion.
(f) Per share and share amounts have been adjusted to reflect the two-for-one stock split distributed on June 17, 2002.
(g) U.S. Company blended same-store sales growth includes the results of Company owned KFC, Pizza Hut and Taco Bell restaurants that have been open one year or more. LJS
and A&W are not included.
(h) International system sales growth includes the results of all international restaurants regardless of ownership, including Company owned, franchise, unconsolidated affiliate
and license restaurants. Sales of franchise, unconsolidated affiliate and license restaurants generate franchise and license fees for the Company (typically at a rate of 4%
to 6% of sales). Franchise, unconsolidated affiliate and license restaurant sales are not included in Company sales we present on the Consolidated Statements of Income;
however, the fees are included in the Company’s revenues.
(i) Local currency is prior to foreign currency conversion to U.S. dollars.