Pizza Hut 2003 Annual Report Download - page 35
Download and view the complete annual report
Please find page 35 of the 2003 Pizza Hut annual report below. You can navigate through the pages in the report by either clicking on the pages listed below, or by using the keyword search tool below to find specific information within the annual report.
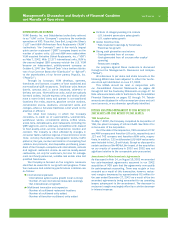
Yum! Brands Inc. 33.Management’s Discussion and Analysis of Financial Condition
and Results of Operations
INTRODUCTION AND OVERVIEW
YUM! Brands, Inc. and Subsidiaries (collectively referred
to as “YUM” or the “Company”) comprises the worldwide
operations of KFC, Pizza Hut, Taco Bell, Long John Silver’s
(“LJS”) and A&W All-American Food Restaurants (“A&W”)
(collectively “the Concepts”) and is the world’s largest
quick service restaurant (“QSR”) company based on the
number of system units. LJS and A&W were added when
YUM acquired Yorkshire Global Restaurants, Inc. (“YGR”)
on May 7, 2002. With 12,377 international units, YUM is
the second largest QSR company outside the U.S. YUM
became an independent, publicly-owned company on
October 6, 1997 (the “Spin-off Date”) via a tax-free distribu-
tion of our Common Stock (the “Distribution” or “Spin-off”)
to the shareholders of our former parent, PepsiCo, Inc.
(“PepsiCo”).
Through its Concepts, YUM develops, operates,
franchises and licenses a system of both traditional and
non-traditional QSR restaurants. Traditional units feature
dine-in, carryout and, in some instances, drive-thru or
delivery services. Non-traditional units, which are typically
licensed outlets, include express units and kiosks which
have a more limited menu and operate in non-traditional
locations like malls, airports, gasoline service stations,
convenience stores, stadiums, amusement parks and
colleges, where a full-scale traditional outlet would not be
practical or efficient.
The retail food industry, in which the Company
competes, is made up of supermarkets, supercenters,
warehouse stores, convenience stores, coffee shops,
snack bars, delicatessens and restaurants (including the
QSR segment), and is intensely competitive with respect
to food quality, price, service, convenience, location and
concept. The industry is often affected by changes in
consumer tastes; national, regional or local economic condi-
tions; currency fluctuations; demographic trends; traffic
patterns; the type, number and location of competing food
retailers and products; and disposable purchasing power.
Each of the Concepts competes with international, national
and regional restaurant chains as well as locally-owned
restaurants, not only for customers, but also for manage-
ment and hourly personnel, suitable real estate sites and
qualified franchisees.
The Company is focused on five long-term measures
identified as essential to our growth and progress. These
five measures and related key performance indicators are
as follows:
International expansion
• International system-sales growth (local currency)
• Number of new international restaurant openings
• Net international unit growth
Multibrand innovation and expansion
• Number of multibrand restaurant locations
• Number of multibrand units added
• Number of franchise multibrand units added
Portfolio of category-leading U.S. brands
• U.S. blended same-store sales growth
• U.S. system-sales growth
Global franchise fees
• New restaurant openings by franchisees
• Franchise fee growth
Strong cash generation and returns
• Cash generated from all sources
• Cash generated from all sources after capital
spending
• Restaurant margins
Our progress against these measures is discussed
throughout the Management’s Discussion and Analysis
(“MD&A”).
All references to per share and share amounts in the
following MD&A have been adjusted to reflect the two-for-
one stock split distributed on June 17, 2002.
This MD&A should be read in conjunction with
our Consolidated Financial Statements on pages 48
through 51 and the Cautionary Statements on page 47. All
Note references herein refer to the Notes to the Consolidated
Financial Statements on pages 52 through 74. Tabular
amounts are displayed in millions except per share and unit
count amounts, or as otherwise specifically identified.
FACTORS AFFECTING COMPARABILITY OF 2003 RESULTS TO
2002 RESULTS AND 2002 RESULTS TO 2001 RESULTS
YGR Acquisition
On May 7, 2002, the Company completed its acquisition of
YGR, the parent company of LJS and A&W. See Note 4 for
a discussion of the acquisition.
As of the date of the acquisition, YGR consisted of 742
and 496 company and franchise LJS units, respectively, and
127 and 742 company and franchise A&W units, respec-
tively. In addition, 133 multibranded LJS/A&W restaurants
were included in the LJS unit totals. Except as discussed in
certain sections of the MD&A, the impact of the acquisition
on our results of operations in 2003 and 2002 was not
significant relative to the comparable prior year period.
Amendment of Sale-Leaseback Agreements
As discussed in Note 14, on August 15, 2003 we amended
two sale-leaseback agreements assumed in our 2002
acquisition of YGR such that the agreements now qualify
for sale-leaseback accounting. There was no gain or loss
recorded as a result of this transaction; however, restau-
rant margins decreased by approximately $3 million for
the year ended December 27, 2003 as a result of the two
amended agreements being accounted for as operating
leases subsequent to the amendment. The decrease in
restaurant margin was largely offset by a similar decrease
in interest expense.


