Pizza Hut 2003 Annual Report Download - page 39
Download and view the complete annual report
Please find page 39 of the 2003 Pizza Hut annual report below. You can navigate through the pages in the report by either clicking on the pages listed below, or by using the keyword search tool below to find specific information within the annual report.-
 1
1 -
2
-
3
-
4
-
5
-
6
-
7
-
8
-
9
-
10
-
11
-
12
-
13
-
14
-
15
-
16
-
17
-
18
-
19
-
20
-
21
-
22
-
23
-
24
-
25
-
26
-
27
-
28
-
 29
29 -
 30
30 -
 31
31 -
 32
32 -
 33
33 -
 34
34 -
 35
35 -
 36
36 -
 37
37 -
 38
38 -
 39
39 -
 40
40 -
 41
41 -
 42
42 -
 43
43 -
 44
44 -
 45
45 -
 46
46 -
 47
47 -
 48
48 -
 49
49 -
50
-
51
-
52
-
53
-
54
-
55
-
56
-
57
-
58
-
59
-
60
-
61
-
62
-
63
-
64
-
65
-
66
-
67
-
68
-
69
-
70
-
71
-
72
-
73
-
74
-
75
-
76
-
77
-
78
-
79
-
80
-
81
-
82
-
83
-
84
 |
 |

Yum! Brands Inc. 37.
The increase in other (income) expense in 2003 was
primarily driven by the improved operating performance of
our unconsolidated affiliates, particularly in China.
WORLDWIDE FACILITY ACTIONS
We recorded a net loss from facility actions of $36 million,
$32 million and $1 million in 2003, 2002 and 2001,
respectively. See the Store Portfolio Strategy section for
more detail of our refranchising and closure activities and
Note 7 for a summary of the components of facility actions
by reportable operating segment.
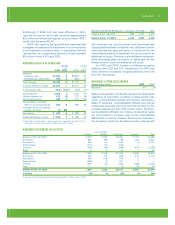
WORLDWIDE OPERATING PROFIT
% B/(W) % B/(W)
vs. vs.
2003 2002 2002 2001
United States $ 812 1 $ 802 15
International 441 22 361 19
Unallocated and corporate
expenses (179) — (178) (20)
Unallocated other income
(expense) (3) NM (1) NM
Unallocated facility actions gain 4 NM 19 NM
Wrench litigation (42) NM — —
AmeriServe and other (charges)
credits 26 NM 27 NM
Operating profit $ 1,059 3 $ 1,030 16
The changes in U.S. and International operating profit for
2003 and 2002 are discussed in the respective sections.
Unallocated and corporate expenses increased
$1 million in 2003 and $30 million or 20% in 2002. The
2002 increase was primarily driven by higher compensation-
related costs and higher corporate and project spending.
Unallocated facility actions comprises refranchising
gains (losses) which are not allocated to the U.S. or
International segments for performance reporting purposes.
See Note 7 for further discussion.
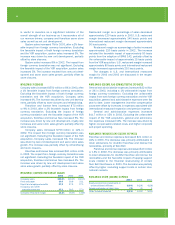
WORLDWIDE INTEREST EXPENSE, NET
2003 2002 2001
Interest expense $ 185 $ 180 $ 172
Interest income (12) (8) (14)
Interest expense, net $ 173 $ 172 $ 158
Interest expense increased $5 million or 3% in 2003.
Excluding the impact of the YGR acquisition, interest
expense decreased 6%. The decrease was primarily due
to a decrease in our average debt outstanding.
Interest expense increased $8 million or 5% in 2002.
Excluding the impact of the YGR acquisition, interest
expense decreased 12%. The decrease was driven by
a reduction in our average debt balance partially offset
by an increase in our average interest rate. Our average
interest rate increased due to a reduction in our variable-
rate borrowings using proceeds from the issuance of longer
term, fixed-rate notes.
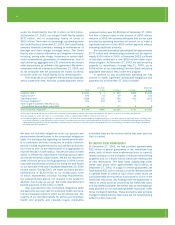
WORLDWIDE INCOME TAXES
2003 2002 2001
Reported
Income taxes $ 268 $ 275 $ 241
Effective tax rate 30.2% 32.1% 32.8%
The reconciliation of income taxes calculated at the U.S.
federal tax statutory rate to our effective tax rate is set
forth below:
2003 2002 2001
U.S. federal statutory tax rate 35.0% 35.0% 35.0%
State income tax, net of federal
tax benefit 1.8 2.0 2.1
Foreign and U.S. tax effects
attributable to foreign operations (3.6) (2.8) (0.7)
Adjustments to reserves and prior years (1.7) (1.8) (1.8)
Foreign tax credit amended
return benefit (4.1) — —
Valuation allowance additions
(reversals) 2.8 — (1.7)
Other, net — (0.3) (0.1)
Effective tax rate 30.2% 32.1% 32.8%
Income taxes and the effective tax rate as shown above
reflect tax on all amounts included in our results of opera-
tions except for the income tax benefit of approximately
$1 million on the $2 million cumulative effect adjustment
recorded in the year ended December 27, 2003 due to the
adoption of SFAS 143.
The 2003 effective tax rate decreased 1.9 percentage
points to 30.2%. The decrease in the effective tax rate was
primarily due to a 4.1 percentage point benefit of amending
certain prior U.S. income tax returns to claim credit for
foreign taxes paid in prior years. The returns were amended
upon our determination that it was more beneficial to claim
credit for such taxes than to deduct such taxes, as had
been done when the returns were originally filed. In future
years, we anticipate continuing to claim credit for foreign
taxes paid in the then current year, as we have done in 2003
and 2002. However, the amended return benefit recognized
in 2003 is non-recurring.
The decrease in the 2003 effective tax rate was
partially offset by the recognition of valuation allowances for
certain deferred tax assets whose realization is no longer
considered more likely than not. The valuation allowances
recognized primarily related to deferred tax assets in Mexico
and Thailand. See Note 22 for a discussion of valuation
allowances.
The 2002 effective tax rate decreased 0.7 percentage
points to 32.1%. The decrease in the effective tax rate
was primarily due to our claiming credit against our current
and future U.S. income tax liability for foreign taxes paid
in 2002, as opposed to deducting such taxes on our U.S.
income tax returns as was done in 2001. This decrease was
partially offset by the impact of lapping valuation allowance
reversals recorded in 2001.
In 2003 and 2002, the effective tax rate attributable to
foreign operations was lower than the U.S. federal statutory