Pizza Hut 2003 Annual Report Download - page 69
Download and view the complete annual report
Please find page 69 of the 2003 Pizza Hut annual report below. You can navigate through the pages in the report by either clicking on the pages listed below, or by using the keyword search tool below to find specific information within the annual report.-
 1
1 -
2
-
3
-
4
-
5
-
6
-
7
-
8
-
9
-
10
-
11
-
12
-
13
-
14
-
15
-
16
-
17
-
18
-
19
-
20
-
21
-
22
-
23
-
24
-
25
-
26
-
27
-
28
-
29
-
30
-
31
-
32
-
33
-
34
-
35
-
36
-
37
-
38
-
39
-
40
-
41
-
42
-
43
-
44
-
45
-
46
-
47
-
48
-
49
-
50
-
51
-
52
-
53
-
54
-
55
-
56
-
57
-
58
-
 59
59 -
 60
60 -
 61
61 -
 62
62 -
 63
63 -
 64
64 -
 65
65 -
 66
66 -
 67
67 -
 68
68 -
 69
69 -
 70
70 -
 71
71 -
 72
72 -
 73
73 -
 74
74 -
 75
75 -
 76
76 -
 77
77 -
 78
78 -
 79
79 -
80
-
81
-
82
-
83
-
84
 |
 |

Yum! Brands Inc. 67.
date of grant. RGM Plan options granted have a four year
vesting period and expire ten years after grant. We may
grant options to purchase up to 14.0 million shares of stock
at a price equal to or greater than the average market
price of the stock on the date of grant under SharePower.
Previously granted SharePower options have expirations
through 2013.
At the Spin-off Date, we converted certain of the
unvested options to purchase PepsiCo stock that were
held by our employees to YUM stock options under either
the 1997 LTIP or SharePower. We converted the options at
amounts and exercise prices that maintained the amount of
unrealized stock appreciation that existed immediately prior
to the Spin-off. The vesting dates and exercise periods of
the options were not affected by the conversion. Based on
their original PepsiCo grant date, these converted options
vest in periods ranging from one to ten years and expire
ten to fifteen years after grant.
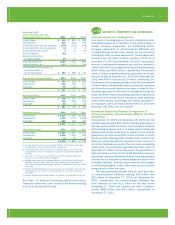
We estimated the fair value of each option grant made
during 2003, 2002 and 2001 as of the date of grant using
the Black-Scholes option-pricing model with the following
weighted average assumptions:
2003 2002 2001
Risk-free interest rate 3.0% 4.3% 4.7%
Expected life (years) 6.0 6.0 6.0
Expected volatility 33.6% 33.9% 32.7%
Expected dividend yield 0.0% 0.0% 0.0%
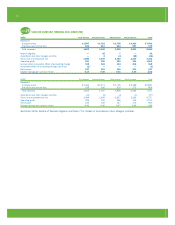
A summary of the status of all options granted to employees
and non-employee directors as of December 27, 2003,
December 28, 2002 and December 29, 2001, and changes
during the years then ended is presented below (tabular
options in thousands):
December 27, 2003 December 28, 2002 December 29, 2001
Wtd. Avg. Wtd. Avg. Wtd. Avg.
Exercise Exercise Exercise
Options Price Options Price Options Price
Outstanding at beginning of year 49,630 $ 17.54 54,452 $ 16.04 53,358 $ 15.60
Granted at price equal to average market price 7,344 24.78 6,974 25.52 10,019 17.34
Exercised (6,902) 16.18 (8,876) 14.06 (3,635) 11.56
Forfeited (3,101) 19.18 (2,920) 19.07 (5,290) 17.16
Outstanding at end of year 46,971 $ 18.77 49,630 $ 17.54 54,452 $ 16.04
Exercisable at end of year 19,875 $ 17.22 17,762 $ 13.74 12,962 $ 12.76
Weighted average fair value of options granted during the year $ 9.43 $ 10.44 $ 7.10
The following table summarizes information about stock options outstanding and exercisable at December 27, 2003
(tabular options in thousands):
Options Outstanding Options Exercisable
Wtd. Avg.
Remaining Wtd. Avg. Wtd. Avg.
Range of Exercise Prices Options Contractual Life Exercise Price Options Exercise Price
$ 0 – 10 882 1.11 $ 7.70 882 $ 7.70
10 – 15 7,757 3.29 12.73 7,109 12.72
15 – 20 20,568 6.09 16.12 5,861 16.36
20 – 30 16,656 7.72 24.42 5,379 23.39
30 – 40 1,108 7.22 34.05 644 36.30
46,971 19,875