Pizza Hut 2003 Annual Report Download - page 40
Download and view the complete annual report
Please find page 40 of the 2003 Pizza Hut annual report below. You can navigate through the pages in the report by either clicking on the pages listed below, or by using the keyword search tool below to find specific information within the annual report.-
 1
1 -
2
-
3
-
4
-
5
-
6
-
7
-
8
-
9
-
10
-
11
-
12
-
13
-
14
-
15
-
16
-
17
-
18
-
19
-
20
-
21
-
22
-
23
-
24
-
25
-
26
-
27
-
28
-
29
-
 30
30 -
 31
31 -
 32
32 -
 33
33 -
 34
34 -
 35
35 -
 36
36 -
 37
37 -
 38
38 -
 39
39 -
 40
40 -
 41
41 -
 42
42 -
 43
43 -
 44
44 -
 45
45 -
 46
46 -
 47
47 -
 48
48 -
 49
49 -
 50
50 -
51
-
52
-
53
-
54
-
55
-
56
-
57
-
58
-
59
-
60
-
61
-
62
-
63
-
64
-
65
-
66
-
67
-
68
-
69
-
70
-
71
-
72
-
73
-
74
-
75
-
76
-
77
-
78
-
79
-
80
-
81
-
82
-
83
-
84
 |
 |

38.
rate primarily due to the benefit of claiming credit against
our current and future U.S. income tax liability for foreign
taxes paid.
Adjustments to reserves and prior years include
the effects of the reconciliation of income tax amounts
recorded in our Consolidated Statements of Income to
amounts reflected on our tax returns, including any adjust-
ments to the Consolidated Balance Sheets. Adjustments
to reserves and prior years also includes changes in tax
reserves established for potential exposure we may incur
if a taxing authority takes a position on a matter contrary
to our position. We evaluate these reserves, including
interest thereon, on a quarterly basis to insure that they
have been appropriately adjusted for events that we believe
may impact our exposure.
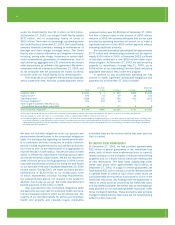
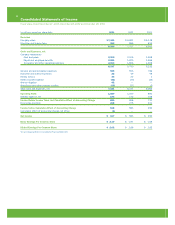
U.S. RESULTS OF OPERATIONS
% B/(W) % B/(W)
vs. vs.
2003 2002 2002 2001
Revenues
Company sales $ 5,081 6 $ 4,778 11
Franchise and license fees 574 1 569 5
Total revenues $ 5,655 6 $ 5,347 11
Company restaurant margin $ 739 (3) $ 764 18
% of Company sales 14.6% (1.4)ppts. 16.0% 0.8)ppts.
Operating profit $ 812 1 $ 802 15
U.S. RESTAURANT UNIT ACTIVITY
Unconsolidated
Company Affiliates.(a) Franchisees Licensees Total
Balance at Dec. 29, 2001 4,284 — 12,733 2,545 19,562
New Builds 210 4 233 136 583
Acquisitions(b) 899 — 1,001 (3) 1,897
Refranchising (47) — 47 — —
Closures (153) — (351) (382) (886)
Other(c) — — — (30) (30)
Balance at Dec. 28, 2002 5,193 4 13,663 2,266 21,126
New Builds 142 3 245 259 649
Acquisitions 106 — (108) 2 —
Refranchising (150) — 148 2 —
Closures (197) (1) (386) (373) (957)
Other — — 4 — 4
Balance at Dec. 27, 2003 5,094 6 13,566 2,156 20,822
% of Total 25% — 65% 10% 100%
(a) Represents Yan Can units.
(b) Includes units that existed at the date of the acquisition of YGR on May 7, 2002.
(c) Represents licensee units transferred from U.S. to International.
U.S. Multibrand Restaurants Company Franchise Total
Balance at Dec. 28, 2002 844 973 1,817
Balance at Dec. 27, 2003 1,032 1,116 2,148
For 2003 and 2002, Company multibrand unit gross addi-
tions were 222 and 212, respectively. For 2003 and 2002,
franchise multibrand unit gross additions were 160 and
153, respectively.
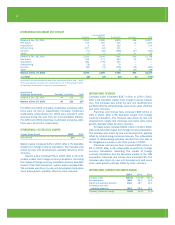
U.S. SYSTEM SALES GROWTH
System Sales Growth 2003 2002
U.S. 3% 9%
System sales increased 3% for 2003. Excluding the favor-
able impact of the YGR acquisition, system sales increased
1%. The increase was driven by new unit development,
partially offset by store closures.
System sales increased 9% in 2002. Excluding the favor-
able impact of the YGR acquisition, system sales increased
4%. The increase resulted from same store sales growth and
new unit development, partially offset by store closures.
U.S. REVENUES
Company sales increased $303 million or 6% in 2003.
Excluding the favorable impact of the YGR acquisition,
company sales increased 2%. The increase was driven by
new unit development, partially offset by store closures
and refranchising.
Franchise and license fees increased $5 million or 1%
in 2003. Excluding the favorable impact of the YGR acquisi-
tion, franchise and license fees remained essentially flat