Pizza Hut 2003 Annual Report Download - page 42
Download and view the complete annual report
Please find page 42 of the 2003 Pizza Hut annual report below. You can navigate through the pages in the report by either clicking on the pages listed below, or by using the keyword search tool below to find specific information within the annual report.-
 1
1 -
2
-
3
-
4
-
5
-
6
-
7
-
8
-
9
-
10
-
11
-
12
-
13
-
14
-
15
-
16
-
17
-
18
-
19
-
20
-
21
-
22
-
23
-
24
-
25
-
26
-
27
-
28
-
29
-
30
-
31
-
 32
32 -
 33
33 -
 34
34 -
 35
35 -
 36
36 -
 37
37 -
 38
38 -
 39
39 -
 40
40 -
 41
41 -
 42
42 -
 43
43 -
 44
44 -
 45
45 -
 46
46 -
 47
47 -
 48
48 -
 49
49 -
 50
50 -
 51
51 -
 52
52 -
53
-
54
-
55
-
56
-
57
-
58
-
59
-
60
-
61
-
62
-
63
-
64
-
65
-
66
-
67
-
68
-
69
-
70
-
71
-
72
-
73
-
74
-
75
-
76
-
77
-
78
-
79
-
80
-
81
-
82
-
83
-
84
 |
 |

40.
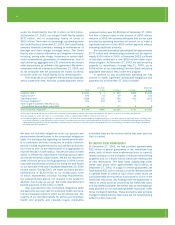
INTERNATIONAL RESTAURANT UNIT ACTIVITY
Unconsolidated
Company Affiliates Franchisees Licensees Total
Balance at Dec. 29, 2001 2,151 2,000 6,530 246 10,927
New Builds 375 161 515 10 1,061
Acquisitions(a) 6 41 163 — 210
Refranchising (127) (14) 141 — —
Closures (71) (46) (298) (27) (442)
Other(b) (1) 2 10 31 42
Balance at Dec. 28, 2002 2,333 2,144 7,061 260 11,798
New Builds 312 173 623 13 1,121
Acquisitions 283 (736) 453 — —
Refranchising (78) (1) 79 — —
Closures (90) (74) (305) (15) (484)
Other(c) — — (6) (52) (58)
Balance at Dec. 27, 2003 2,760 1,506 7,905 206 12,377
% of Total 22% 12% 64% 2% 100%
(a) Includes units that existed at the date of the acquisition of YGR on May 7, 2002.
(b) Primarily represents licensee units transferred from U.S. to International in 2002.
(c) Represents an adjustment of previously reported amounts.
INTERNATIONAL REVENUES
Company sales increased $247 million or 12% in 2003,
after a 4% favorable impact from foreign currency transla-
tion. The increase was driven by new unit development,
partially offset by refranchising, same store sales declines
and store closures.
Franchise and license fees increased $68 million or
23% in 2003, after a 9% favorable impact from foreign
currency translation. The increase was driven by new unit
development, royalty rate increases and same store sales
growth, partially offset by store closures.
Company sales increased $262 million or 14% in 2002,
after a 1% favorable impact from foreign currency translation.
The increase was driven by new unit development, partially
offset by refranchising and store closures. The unfavorable
impact of refranchising primarily resulted from the sale of
the Singapore business in the third quarter of 2002.
Franchise and license fees increased $22 million or
8% in 2002, after a 1% unfavorable impact from foreign
currency translation. Excluding the impact of foreign
currency translation and the favorable impact of the YGR
acquisition, franchise and license fees increased 8%. The
increase was driven by new unit development and same
store sales growth, partially offset by store closures.
INTERNATIONAL COMPANY RESTAURANT MARGIN
2003 2002 2001
Company sales 100.0% 100.0% 100.0%
Food and paper 35.5 36.1 36.9
Payroll and employee benefits 19.0 18.7 19.1
Occupancy and other
operating expenses 30.0 29.2 30.1
Company restaurant margin 15.5% 16.0% 13.9%
International
Multibrand Restaurants Company Franchise Total
Balance at Dec. 28, 2002 44 114 158
Balance at Dec. 27, 2003 64 133 197
For 2003 and 2002, Company multibrand unit gross addi-
tions were 13 and 4, respectively. Company multibrand
restaurants at December 27, 2003 also include 9 units
acquired during the year from an unconsolidated affiliate.
For 2003 and 2002, franchise multibrand unit gross addi-
tions were 34 and 13, respectively.
INTERNATIONAL SYSTEM SALES GROWTH
System Sales Growth 2003 2002
International 14% 8%
System sales increased 14% in 2003, after a 7% favorable
impact from foreign currency translation. The increase was
driven by new unit development, partially offset by store
closures.
System sales increased 8% in 2002, after a 1% unfa-
vorable impact from foreign currency translation. Excluding
the impact of foreign currency translation and the favorable
impact of the YGR acquisition, system sales increased 8%.
The increase was driven by new unit development and same
store sales growth, partially offset by store closures.