Pizza Hut 2003 Annual Report Download - page 51
Download and view the complete annual report
Please find page 51 of the 2003 Pizza Hut annual report below. You can navigate through the pages in the report by either clicking on the pages listed below, or by using the keyword search tool below to find specific information within the annual report.-
 1
1 -
2
-
3
-
4
-
5
-
6
-
7
-
8
-
9
-
10
-
11
-
12
-
13
-
14
-
15
-
16
-
17
-
18
-
19
-
20
-
21
-
22
-
23
-
24
-
25
-
26
-
27
-
28
-
29
-
30
-
31
-
32
-
33
-
34
-
35
-
36
-
37
-
38
-
39
-
40
-
 41
41 -
 42
42 -
 43
43 -
 44
44 -
 45
45 -
 46
46 -
 47
47 -
 48
48 -
 49
49 -
 50
50 -
 51
51 -
 52
52 -
 53
53 -
 54
54 -
 55
55 -
 56
56 -
 57
57 -
 58
58 -
 59
59 -
 60
60 -
 61
61 -
62
-
63
-
64
-
65
-
66
-
67
-
68
-
69
-
70
-
71
-
72
-
73
-
74
-
75
-
76
-
77
-
78
-
79
-
80
-
81
-
82
-
83
-
84
 |
 |

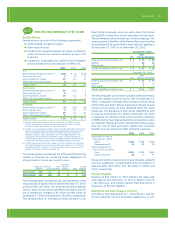
Yum! Brands Inc. 49.
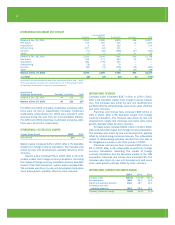
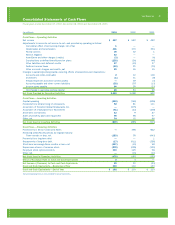
Consolidated Statements of Cash Flows
Fiscal years ended December 27, 2003, December 28, 2002 and December 29, 2001
(in millions) 2003 2002 2001
Cash Flows — Operating Activities
Net income $ 617 $ 583 $ 492
Adjustments to reconcile net income to net cash provided by operating activities:
Cumulative effect of accounting change, net of tax 1 — —
Depreciation and amortization 401 370 354
Facility actions 36 32 1
Wrench litigation 42 — —
AmeriServe and other charges (credits) (3) — (6)
Contributions to defined benefit pension plans (132) (26) (48)
Other liabilities and deferred credits 17 (12) 37
Deferred income taxes (23) 21 (72)
Other non-cash charges and credits, net 32 36 15
Changes in operating working capital, excluding effects of acquisitions and dispositions:
Accounts and notes receivable 2 32 116
Inventories (1) 11 (8)
Prepaid expenses and other current assets — 19 (3)
Accounts payable and other current liabilities (32) (37) (13)
Income taxes payable 96 59 (33)
Net change in operating working capital 65 84 59
Net Cash Provided by Operating Activities 1,053 1,088 832
Cash Flows — Investing Activities
Capital spending (663) (760) (636)
Proceeds from refranchising of restaurants 92 81 111
Acquisition of Yorkshire Global Restaurants, Inc. — (275) —
Acquisition of restaurants from franchisees (41) (13) (108)
Short-term investments 13 9 27
Sales of property, plant and equipment 46 58 57
Other, net 34 15 46
Net Cash Used in Investing Activities (519) (885) (503)
Cash Flows — Financing Activities
Proceeds from Senior Unsecured Notes — 398 842
Revolving Credit Facility activity, by original maturity
Three months or less, net (153) 59 (943)
Proceeds from long-term debt — — 1
Repayments of long-term debt (17) (511) (258)
Short-term borrowings-three months or less, net (137) (15) 58
Repurchase shares of common stock (278) (228) (100)
Employee stock option proceeds 110 125 58
Other, net — (15) (10)
Net Cash Used in Financing Activities (475) (187) (352)
Effect of Exchange Rate on Cash and Cash Equivalents 3 4 —
Net Increase (Decrease) in Cash and Cash Equivalents 62 20 (23)
Cash and Cash Equivalents — Beginning of Year 130 110 133
Cash and Cash Equivalents — End of Year $ 192 $ 130 $ 110
See accompanying Notes to Consolidated Financial Statements.