Pizza Hut 2003 Annual Report Download - page 43
Download and view the complete annual report
Please find page 43 of the 2003 Pizza Hut annual report below. You can navigate through the pages in the report by either clicking on the pages listed below, or by using the keyword search tool below to find specific information within the annual report.-
 1
1 -
2
-
3
-
4
-
5
-
6
-
7
-
8
-
9
-
10
-
11
-
12
-
13
-
14
-
15
-
16
-
17
-
18
-
19
-
20
-
21
-
22
-
23
-
24
-
25
-
26
-
27
-
28
-
29
-
30
-
31
-
32
-
 33
33 -
 34
34 -
 35
35 -
 36
36 -
 37
37 -
 38
38 -
 39
39 -
 40
40 -
 41
41 -
 42
42 -
 43
43 -
 44
44 -
 45
45 -
 46
46 -
 47
47 -
 48
48 -
 49
49 -
 50
50 -
 51
51 -
 52
52 -
 53
53 -
54
-
55
-
56
-
57
-
58
-
59
-
60
-
61
-
62
-
63
-
64
-
65
-
66
-
67
-
68
-
69
-
70
-
71
-
72
-
73
-
74
-
75
-
76
-
77
-
78
-
79
-
80
-
81
-
82
-
83
-
84
 |
 |

Yum! Brands Inc. 41.
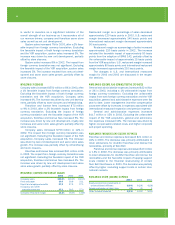
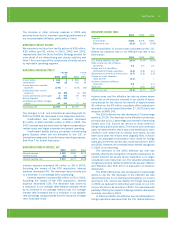
Restaurant margin as a percentage of sales decreased
approximately 50 basis points in 2003, including a 20 basis
points unfavorable impact from foreign currency translation.
The remaining decrease was driven by the impact on margin
of same store sales declines. These decreases were partially
offset by the impact of supply chain savings initiatives on the
cost of food and paper (principally in China), and the cessa-
tion of depreciation expense of approximately $9 million for
the Puerto Rico business which is held for sale.
Restaurant margin as a percentage of sales increased
approximately 210 basis points in 2002, including the
favorable impact of approximately 60 basis points from
the adoption of SFAS 142. The increase was primarily driven
by the favorable impact of lower restaurant operating costs
and the elimination of lower average margin units through
store closures. Lower restaurant operating costs primarily
resulted from lower food and paper costs, partially offset
by higher labor costs.
INTERNATIONAL OPERATING PROFIT
Operating profit increased $80 million or 22% in 2003,
including a 7% favorable impact from foreign currency
translation. The remaining increase was driven by new unit
development and the impact of supply chain savings initia-
tives on the cost of food and paper, partially offset by the
impact of same store sales declines on margins and higher
general and administrative expenses.
Operating profit increased $56 million or 19% in 2002.
Excluding the impact of foreign currency translation and the
favorable impact from the adoption of SFAS 142, operating
profit increased 13%. The increase was driven by new unit
development and the favorable impact of lower restaurant
operating costs, primarily lower cost of food and paper. The
increase was partially offset by higher general and adminis-
trative expenses, primarily compensation-related costs.
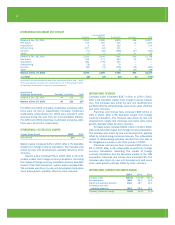
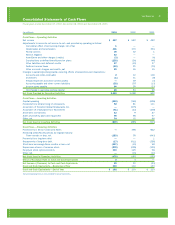
CONSOLIDATED CASH FLOWS
Net cash provided by operating activities was
$1,053 million
compared to $1,088 million in 2002. The
decrease was primarily driven by $130 million in voluntary
contributions to our funded pension plan in 2003, partially
offset by higher net income.
In 2002, net cash provided by operating activities
was $1,088 million compared to $832 million in 2001.
Excluding the impact of the AmeriServe bankruptcy reorga-
nization process, cash provided by operating activities was
$1,043 million versus $704 million in 2001. The increase
was driven by higher net income and timing of tax receipts
and payments.
Net cash used in investing activities was $519 million
versus $885 million in 2002. The decrease in cash used
was driven by the $275 million acquisition of YGR in 2002
and lower capital spending in 2003.
In 2002, net cash used in investing activities was
$885 million versus $503 million in 2001. The increase in
cash used was primarily due to the acquisition of YGR and
higher capital spending in 2002, partially offset by the acqui-
sition of fewer restaurants from franchisees in 2002.
Net cash used in financing activities was $475 million
versus $187 million in 2002. The increase was driven by
higher net debt repayments and higher shares repurchased
in 2003.
In 2002, net cash used in financing activities was
$187 million versus $352 million in 2001. The decrease is
primarily due to lower debt repayments and higher proceeds
from stock option exercises versus 2001, partially offset
by higher shares repurchased in 2002.
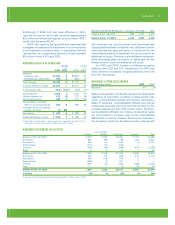
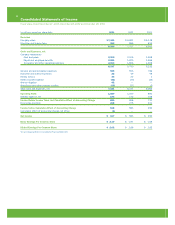
CONSOLIDATED FINANCIAL CONDITION
Assets increased $220 million or 4% to $5.6 billion
primarily due to a net increase in property, plant and
equipment, driven by capital expenditures in excess of
depreciation and asset dispositions. The decrease in
the allowance for doubtful accounts from $42 million to
$28 million was primarily the result of the write-off of receiv-
ables previously fully reserved.
Liabilities decreased $306 million or 6% to $4.5 billion
primarily due to the repayment of amounts under our Credit
Facility, decreased short-term borrowings and the reduc-
tion in long-term debt as a result of the amendment of
certain sale-leaseback agreements (see Note 14). These
decreases were partially offset by an increase in accounts
payable and other current liabilities primarily due to the
accrual of $42 million related to the Wrench litigation.
LIQUIDITY AND CAPITAL RESOURCES
Operating in the QSR industry allows us to generate
substantial cash flows from the operations of our company
stores and from our franchise operations, which require a
limited YUM investment. In each of the last two fiscal years,
net cash provided by operating activities has exceeded $1
billion. These cash flows have allowed us to fund our
discretionary spending, while at the same time reducing
our long-term debt balances. We expect these levels of net
cash provided by operating activities to continue in the fore-
seeable future. Our discretionary spending includes capital
spending for new restaurants, acquisitions of restaurants
from franchisees and repurchases of shares of our common
stock. Though a decline in revenues could adversely impact
our cash flows from operations, we believe our operating
cash flows, our ability to reduce discretionary spending,
and our borrowing capacity will allow us to meet our cash
requirements in 2004 and beyond.
Our primary bank credit agreement comprises a senior
unsecured Revolving Credit Facility (the “Credit Facility”)
which matures on June 25, 2005. On December 26,
2003, we voluntarily reduced our maximum borrowings