Pizza Hut 2003 Annual Report Download - page 37
Download and view the complete annual report
Please find page 37 of the 2003 Pizza Hut annual report below. You can navigate through the pages in the report by either clicking on the pages listed below, or by using the keyword search tool below to find specific information within the annual report.-
 1
1 -
2
-
3
-
4
-
5
-
6
-
7
-
8
-
9
-
10
-
11
-
12
-
13
-
14
-
15
-
16
-
17
-
18
-
19
-
20
-
21
-
22
-
23
-
24
-
25
-
26
-
 27
27 -
 28
28 -
 29
29 -
 30
30 -
 31
31 -
 32
32 -
 33
33 -
 34
34 -
 35
35 -
 36
36 -
 37
37 -
 38
38 -
 39
39 -
 40
40 -
 41
41 -
 42
42 -
 43
43 -
 44
44 -
 45
45 -
 46
46 -
 47
47 -
48
-
49
-
50
-
51
-
52
-
53
-
54
-
55
-
56
-
57
-
58
-
59
-
60
-
61
-
62
-
63
-
64
-
65
-
66
-
67
-
68
-
69
-
70
-
71
-
72
-
73
-
74
-
75
-
76
-
77
-
78
-
79
-
80
-
81
-
82
-
83
-
84
 |
 |

Yum! Brands Inc. 35.
Additionally, if SFAS 142 had been effective in 2001,
reported net income would have increased approximately
$26 million and diluted earnings per common share (“EPS”)
would have increased $0.09.
SFAS 142 requires that goodwill and indefinite-lived
intangibles be evaluated for impairment on an annual basis
or as impairment indicators exist. In accordance with this
requirement, we recognized impairment of approximately
$5 million in both 2003 and 2002.
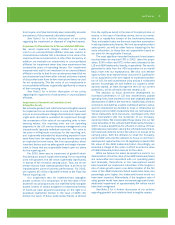
WORLDWIDE RESULTS OF OPERATIONS
% B/(W) % B/(W)
vs. vs.
2003 2002 2002 2001
Revenues
Company sales $ 7,441 8 $ 6,891 12
Franchise and license fees 939 9 866 6
Total revenues $ 8,380 8 $ 7,757 12
Company restaurant margin $ 1,104 — $ 1,101 22
% of Company sales 14.8% (1.2)ppts. 16.0% 1.2
)ppts.
Operating profit 1,059 3 1,030 16
Interest expense, net 173 (1) 172 (8)
Income tax provision 268 3 275 (15)
Income before cumulative
effect of accounting change 618 6 583 18
Cumulative effect of accounting
change, net of tax (1) NM — —
Net income $ 617 6 $ 583 18
Diluted earnings per share(a) $ 2.02 7 $ 1.88 16
(a) See Note 6 for the number of shares used in this calculation. See Note 12 for a
discussion of the proforma impact of SFAS 142 on EPS in 2001.
WORLDWIDE RESTAURANT UNIT ACTIVITY
Unconsolidated
Company Affiliates Franchisees Licensees Total
Balance at Dec. 29, 2001 6,435 2,000 19,263 2,791 30,489
New Builds 585 165 748 146 1,644
Acquisitions(a) 905 41 1,164 (3) 2,107
Refranchising (174) (14) 188 — —
Closures (224) (46) (649) (409) (1,328)
Other (1) 2 10 1 12
Balance at Dec. 28, 2002 7,526 2,148 20,724 2,526 32,924
New Builds 454 176 868 272 1,770
Acquisitions 389 (736) 345 2 —
Refranchising (228) (1) 227 2 —
Closures (287) (75) (691) (388) (1,441)
Other — — (2) (52) (54)
Balance at Dec. 27, 2003 7,854 1,512 21,471 2,362 33,199
% of Total 24% 4% 65% 7% 100%
(a) Includes units that existed at the date of the acquisition of YGR on May 7, 2002.
Worldwide Multibrand Restaurants Company Franchise Total
Balance at Dec. 28, 2002 888 1,087 1,975
Balance at Dec. 27, 2003 1,096 1,249 2,345
The franchise unit counts include both franchisee and
unconsolidated affiliate multibrand units. Multibrand conver-
sions increase the sales and points of distribution for the
second brand added to a restaurant but do not result in an
additional unit count. Similarly, a new multibrand restaurant,
while increasing sales and points of distribution for two
brands, results in just one additional unit count.
For 2003 and 2002, Company multibrand unit gross
additions were 235 and 216, respectively. For 2003 and
2002, franchise multibrand unit gross additions were 194
and 166, respectively.
WORLDWIDE SYSTEM SALES GROWTH
System Sales Growth 2003 2002
Worldwide 7% 8%
System sales growth includes the results of all restaurants
regardless of ownership, including company-owned, fran-
chise, unconsolidated affiliate and license restaurants.
Sales of franchise, unconsolidated affiliate and license
restaurants generate franchise and license fees for the
company (typically at a rate of 4% to 6% of sales). Franchise,
unconsolidated affiliate and license restaurants sales
are not included in company sales on the Consolidated
Statements of Income; however, the fees are included in
the Company’s revenues. We believe system sales growth