Pizza Hut 2003 Annual Report Download - page 41
Download and view the complete annual report
Please find page 41 of the 2003 Pizza Hut annual report below. You can navigate through the pages in the report by either clicking on the pages listed below, or by using the keyword search tool below to find specific information within the annual report.-
 1
1 -
2
-
3
-
4
-
5
-
6
-
7
-
8
-
9
-
10
-
11
-
12
-
13
-
14
-
15
-
16
-
17
-
18
-
19
-
20
-
21
-
22
-
23
-
24
-
25
-
26
-
27
-
28
-
29
-
30
-
 31
31 -
 32
32 -
 33
33 -
 34
34 -
 35
35 -
 36
36 -
 37
37 -
 38
38 -
 39
39 -
 40
40 -
 41
41 -
 42
42 -
 43
43 -
 44
44 -
 45
45 -
 46
46 -
 47
47 -
 48
48 -
 49
49 -
 50
50 -
 51
51 -
52
-
53
-
54
-
55
-
56
-
57
-
58
-
59
-
60
-
61
-
62
-
63
-
64
-
65
-
66
-
67
-
68
-
69
-
70
-
71
-
72
-
73
-
74
-
75
-
76
-
77
-
78
-
79
-
80
-
81
-
82
-
83
-
84
 |
 |

Yum! Brands Inc. 39.
as a decrease primarily driven by store closures was largely
offset by new unit development.
Company sales increased $491 million or 11% in
2002. Excluding the favorable impact of the YGR acquisi-
tion, company sales increased 3%. The increase was driven
by new unit development and same store sales growth.
The increase was partially offset by store closures and
refranchising.
Franchise and license fees increased $29 million or
5% in 2002. Excluding the favorable impact of the YGR
acquisition, franchise and license fees increased 3%. The
increase was driven by same store sales growth and new
unit development, partially offset by store closures.
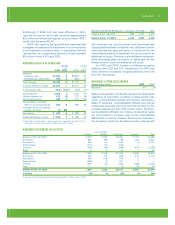
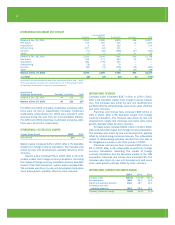
U.S. SAME STORE SALES
U.S. same store sales includes only company restaurants
that have been open one year or more. U.S. blended same
store sales include KFC, Pizza Hut, and Taco Bell company
owned restaurants only. U.S. same store sales for Long John
Silver’s and A&W restaurants are not included. Following are
the same store sales growth results by brand:
2003
Same Average
Store Trans- Guest
Sales actions Check
KFC (2)% (4)% 2%
Pizza Hut (1)% (4)% 3%
Taco Bell 2% 1% 1%
2002
Same Average
Store Trans- Guest
Sales actions Check
KFC — (2)% 2%
Pizza Hut — (2)% 2%
Taco Bell 7% 4% 3%
For 2003, blended Company same store sales were flat
due to a decrease in transactions offset by an increase in
average guest check. For 2002, blended Company same
store sales were up 2% due to increases in both transac-
tions and average guest check.
U.S. COMPANY RESTAURANT MARGIN
2003 2002 2001
Company sales 100.0% 100.0% 100.0%
Food and paper 28.8 28.2 28.6
Payroll and employee benefits 31.0 30.9 30.6
Occupancy and other operating
expenses 25.6 24.9 25.6
Company restaurant margin 14.6% 16.0% 15.2%
Restaurant margin as a percentage of sales decreased
approximately 140 basis points in 2003. The decrease
was primarily driven by increased occupancy expenses
due to higher rent, primarily due to additional rent expense
associated with the amended YGR sale-leaseback agree-
ments, and utilities. The higher food and paper costs were
primarily due to the impact of unfavorable discounting and
product mix. Also contributing to the decrease was higher
labor costs, primarily driven by low single-digit increases
in wage rates.
Restaurant margin as a percentage of sales increased
approximately 80 basis points in 2002. The increase
includes the favorable impact of approximately 50 basis
points from the adoption of SFAS 142, which was partially
offset by the unfavorable impact of approximately 20 basis
points from the YGR acquisition. The increase was primarily
driven by the favorable impact of same store sales growth
on margin and lower food and paper costs, partially offset by
an increase in labor costs. The decrease in food and paper
costs was primarily driven by cheese costs. The increase in
labor costs was primarily driven by wage rates.
U.S. OPERATING PROFIT
Operating profit increased $10 million or 1% in 2003.
Excluding the favorable impact of the YGR acquisition,
operating profit was flat compared to 2002. Decreases
driven by lower margins as a result of increased occupancy
expenses and the impact of unfavorable discounting and
product mix shift on food and paper costs were offset by
lower franchise and license and general and administrative
expenses.
Operating profit increased $107 million or 15% in
2002, including a 3% favorable impact from the adoption
of SFAS 142. Excluding the favorable impact of both SFAS
142 and the YGR acquisition, operating profit increased
9%. The increase was driven by same store sales growth
and the favorable impact of lapping franchise support costs
related to the restructuring of certain Taco Bell franchisees
in 2001. The increase was partially offset by higher restau-
rant operating costs, primarily due to higher labor costs, and
the unfavorable impact of refranchising and store closures.
The higher labor costs were driven by wage rates.
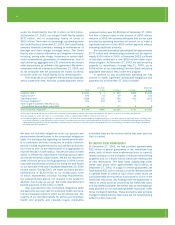
INTERNATIONAL RESULTS OF OPERATIONS
% B/(W) % B/(W)
vs. vs.
2003 2002 2002 2001
Revenue
Company sales $ 2,360 12 $ 2,113 14
Franchise and license fees 365 23 297 8
Total revenues $ 2,725 13 $ 2,410 13
Company restaurant margin $ 365 8 $ 337 31
% of Company sales 15.5% (0.5)ppts. 16.0% 2.1)ppts.
Operating profit $ 441 22 $ 361 19