Pizza Hut 2003 Annual Report Download - page 34
Download and view the complete annual report
Please find page 34 of the 2003 Pizza Hut annual report below. You can navigate through the pages in the report by either clicking on the pages listed below, or by using the keyword search tool below to find specific information within the annual report.-
 1
1 -
2
-
3
-
4
-
5
-
6
-
7
-
8
-
9
-
10
-
11
-
12
-
13
-
14
-
15
-
16
-
17
-
18
-
19
-
20
-
21
-
22
-
23
-
 24
24 -
 25
25 -
 26
26 -
 27
27 -
 28
28 -
 29
29 -
 30
30 -
 31
31 -
 32
32 -
 33
33 -
 34
34 -
 35
35 -
 36
36 -
 37
37 -
 38
38 -
 39
39 -
 40
40 -
 41
41 -
 42
42 -
 43
43 -
 44
44 -
45
-
46
-
47
-
48
-
49
-
50
-
51
-
52
-
53
-
54
-
55
-
56
-
57
-
58
-
59
-
60
-
61
-
62
-
63
-
64
-
65
-
66
-
67
-
68
-
69
-
70
-
71
-
72
-
73
-
74
-
75
-
76
-
77
-
78
-
79
-
80
-
81
-
82
-
83
-
84
 |
 |

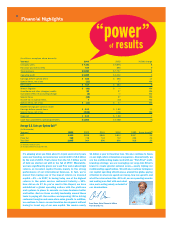
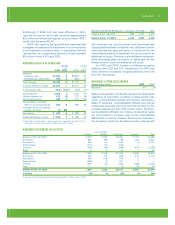
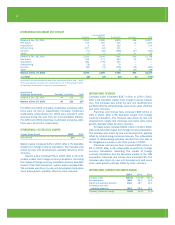
Financial Highlights
Year-end 2003
2003
2002
2002
% B(W) change
% B(W) change
Company sales
Company sales
$ 7,441
$ 7,441
$ 6,891
$ 6,891
8
8
Franchise and license fees
Franchise and license fees
939
939
866
866
9
9
Total revenues
Total revenues
$ 8,380 $ 7,757 8
$ 7,757 8
Operating profit
Operating profit
$ 1,059 $ 1,030 3
$ 1,030 3
Earnings before special items
Earnings before special items
$ 628
$ 628
$ 566 11
$ 566 11
Special items, net of tax
Special items, net of tax
(11) 17
17
NM
NM
Net income
Net income
$ 617
$ 617
$ 583 6
$ 583 6
Wrench litigation
Wrench litigation
$ (42)
$ (42)
$ — NM
$ — NM
AmeriServe and other (charges) credits
AmeriServe and other (charges) credits
26 27
27
NM
NM
Cumulative effect of accounting change
Cumulative effect of accounting change
(2) —
—
NM
NM
Special items
Special items
(18) 27
27
NM
NM
Income tax on special items
Income tax on special items
7 (10)
(10)
NM
NM
Special items, net of tax
Special items, net of tax
$ (11)
$ (11)
$ 17 NM
$ 17 NM
Diluted earnings per common share:
Diluted earnings per common share:
Earnings before special items
Earnings before special items
$ 2.06
$ 2.06
$ 1.82 13
$ 1.82 13
Special items, net of tax
Special items, net of tax
(0.04) 0.06
0.06
NM
NM
Reported
Reported
$ 2.02
$ 2.02
$ 1.88 7
$ 1.88 7
Cash flows provided by operating activities
Cash flows provided by operating activities
$ 1,053 $ 1,088 (3)
$ 1,088 (3)
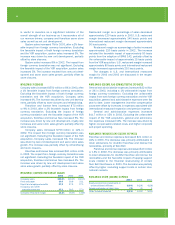
Average U.S. Sales per System Unit
Average U.S. Sales per System Unit
(a)
(In thousands)
(In thousands)
Year-end
Year-end
2003 2002 2001 2000
2002 2001 2000
1999 5-year growth
1999 5-year growth
(b)
KFC
KFC
$ 898
$ 898
$ 898 $ 865 $ 833
$ 898 $ 865 $ 833
$ 837 2%
$ 837 2%
Pizza Hut
Pizza Hut
748 748 724 712
748 724 712
696 3%
696 3%
Taco Bell
Taco Bell
1,005 964 890 896
964 890 896
918 2%
918 2%
(a) Excludes license units.
(a) Excludes license units.
(b) Compounded annual growth rate.
(b) Compounded annual growth rate.
$1 billion a year in franchise fees. We also continue to focus
on our high-return international expansion. Domestically, we
are the multibranding leader and with our “Fish First” multi-
branding strategy, we are leveraging our Long John Silver’s
brand to create greater national scale — nearly tripling our
multibranding opportunities. We will also continue to improve
our capital spending effectiveness around the globe, paying
attention to where we spend our money, how we spend it, and
what the returns look like. All in all, we are spending smarter
and making sure that with each deci-
sion, we’re acting wisely on behalf of
our shareholders.
It’s amazing when you think about it. In just seven short years
since our founding, we lowered our overall debt to $2.1 billion
by the end of 2003. That’s down from the $4.7 billion worth
of debt we started out with in the fall of 1997. Meanwhile,
we have significantly grown our cash flow and realized high
returns on invested capital thanks mainly to the strong
performance of our international business. In fact, we’ve
moved from having one of the lowest returns on invested
capital — 8% — in 1997, to having today one of the highest
returns in the quick service restaurant industry — 18%.
How did we do it? As you’ve read in this Report, we have
established a global operating culture with the platforms
and systems in place to execute our base business better
and better. And our focus on daily leadership around these
tools is paying off. Our metrics are improving: We’re driving
restaurant margins and same-store sales growth. In addition,
we continue to focus on new franchise development without
having to invest any of our own capital. We receive nearly Dave Deno, Chief Financial Offi cer
Yum! Brands, Inc.
(In millions, except per share amounts)
(In millions, except per share amounts)
32.
““powerpower””
results
ofof