Pizza Hut 2003 Annual Report Download - page 33
Download and view the complete annual report
Please find page 33 of the 2003 Pizza Hut annual report below. You can navigate through the pages in the report by either clicking on the pages listed below, or by using the keyword search tool below to find specific information within the annual report.-
 1
1 -
2
-
3
-
4
-
5
-
6
-
7
-
8
-
9
-
10
-
11
-
12
-
13
-
14
-
15
-
16
-
17
-
18
-
19
-
20
-
21
-
22
-
 23
23 -
 24
24 -
 25
25 -
 26
26 -
 27
27 -
 28
28 -
 29
29 -
 30
30 -
 31
31 -
 32
32 -
 33
33 -
 34
34 -
 35
35 -
 36
36 -
 37
37 -
 38
38 -
 39
39 -
 40
40 -
 41
41 -
 42
42 -
 43
43 -
44
-
45
-
46
-
47
-
48
-
49
-
50
-
51
-
52
-
53
-
54
-
55
-
56
-
57
-
58
-
59
-
60
-
61
-
62
-
63
-
64
-
65
-
66
-
67
-
68
-
69
-
70
-
71
-
72
-
73
-
74
-
75
-
76
-
77
-
78
-
79
-
80
-
81
-
82
-
83
-
84
 |
 |

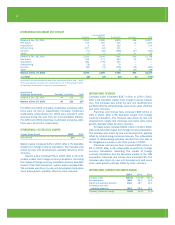
Worldwide System Units
Year-end 2003 2002 %B(W) change
Company 7,854 7,526 4
Unconsolidated affl iates 1,512 2,148 (30)
Franchisees 21,471 20,724 4
Licensees 2,362 2,526 (6)
Total 33,199 32,924 1
5-year.
Year-end 2003 2002 2001 2000 1999 growth.
(a)(b)
United States
KFC 5,524 5,472 5,399 5,364 5,231 2
Pizza Hut 7,523 7,599 7,719 7,927 8,084 (2)
Taco Bell 5,989 6,165 6,444 6,746 6,879 (3)
Long John Silver’s 1,204 1,221 NM
A&W 576 665 NM
Total U.S.
(c) 20,822 21,126 19,562 20,037 20,194 (1)
International
KFC 7,354 6,890 6,416 5,974 5,595 7
Pizza Hut 4,560 4,431 4,272 4,157 3,961 3
Taco Bell 249 267 239 249 232 2
Long John Silver’s 31 28 NM
A&W 183 182 NM
Total International 12,377 11,798 10,927 10,380 9,788 5
Total(c) 33,199 32,924 30,489 30,417 29,982 1
(a) Compounded annual growth rate; total U.S., International and Worldwide exclude the impact of Long John Silver’s and A&W.
(b) Compounded annual growth rate excludes the impact of transferring 30 units from Taco Bell U.S. to Taco Bell International in 2002.
(c) Includes 6 and 4 Yan Can units in 2003 and 2002, respectively.
Breakdown of Worldwide System Units
Unconsolidated
Year-end 2003 Company Affiliate Franchised Licensed Total
United States
KFC 1,252 — 4,204 68 5,524
Pizza Hut 1,776 — 4,624 1,123 7,523
Taco Bell 1,284 — 3,743 962 5,989
Long John Silver’s 701 — 502 1 1,204
A&W 81 — 493 2 576
Total U.S.(a) 5,094 6 13,566 2,156 20,822
International
KFC 1,685 773 4,835 61 7,354
Pizza Hut 1,021 733 2,708 98 4,560
Taco Bell 54 — 150 45 249
Long John Silver’s — — 30 1 31
A&W — — 182 1 183
Total International 2,760 1,506 7,905 206 12,377
Total 7,854 1,512 21,471 2,362 33,199
(a) Includes 6 Yan Can units.
Worldwide Units
Year-end 2003 (in thousands)
33
31
21
11
9
7
6
Yum! Brands
McDonald’s
Subway
Burger King
Wendy’s
Domino’s Pizza
Dairy Queen
Unit Information
31.