Pizza Hut 2003 Annual Report Download - page 68
Download and view the complete annual report
Please find page 68 of the 2003 Pizza Hut annual report below. You can navigate through the pages in the report by either clicking on the pages listed below, or by using the keyword search tool below to find specific information within the annual report.-
 1
1 -
2
-
3
-
4
-
5
-
6
-
7
-
8
-
9
-
10
-
11
-
12
-
13
-
14
-
15
-
16
-
17
-
18
-
19
-
20
-
21
-
22
-
23
-
24
-
25
-
26
-
27
-
28
-
29
-
30
-
31
-
32
-
33
-
34
-
35
-
36
-
37
-
38
-
39
-
40
-
41
-
42
-
43
-
44
-
45
-
46
-
47
-
48
-
49
-
50
-
51
-
52
-
53
-
54
-
55
-
56
-
57
-
 58
58 -
 59
59 -
 60
60 -
 61
61 -
 62
62 -
 63
63 -
 64
64 -
 65
65 -
 66
66 -
 67
67 -
 68
68 -
 69
69 -
 70
70 -
 71
71 -
 72
72 -
 73
73 -
 74
74 -
 75
75 -
 76
76 -
 77
77 -
 78
78 -
79
-
80
-
81
-
82
-
83
-
84
 |
 |

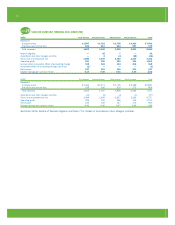
66.
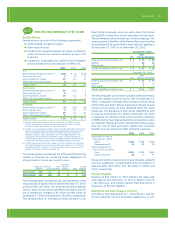
Weighted-average assumptions used to determine the net periodic benefit cost for fiscal years:
Pension Benefits Postretirement Medical Benefits
2003 2002 2001 2003 2002 2001
Discount rate 6.85% 7.60% 8.03% 6.85% 7.58% 8.27%
Long-term rate of return on plan assets 8.50% 10.00% 10.00% — — —
Rate of compensation increase 3.85% 4.60% 5.03% 3.85% 4.60% 5.03%
Our estimated long-term rate of return on plan assets
represents a weighted-average of expected future returns
on the asset categories included in our target investment
allocation based primarily on the historical returns for each
asset category, adjusted for an assessment of current
market conditions.
Assumed health care cost trend rates at September 30:
Postretirement
Medical Benefits
2003 2002
Health care cost trend rate assumed for next year 12% 12%
Rate to which the cost trend rate is assumed to
decline (the ultimate trend rate) 5.5% 5.5%
Year that the rate reaches the ultimate trend rate 2012 2011
There is a cap on our medical liability for certain retirees.
The cap for Medicare eligible retirees was reached in 2000
and the cap for non-Medicare eligible retirees is expected to
be reached between the years 2007–2008; once the cap is
reached, our annual cost per retiree will not increase.
Assumed health care cost trend rates have a signifi-
cant effect on the amounts reported for our postretirement
health care plans. A one-percentage-point change in
assumed health care cost trend rates would have the
following effects:
1-Percentage- 1-Percentage-
Point Point
Increase Decrease
Effect on total of service and interest cost $ — $ —
Effect on postretirement benefit obligation $ 4 $ (3)
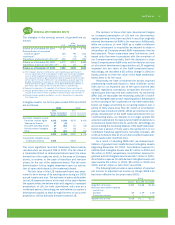
Plan Assets
Our pension plan weighted-average asset allocations at
September 30, by asset category are set forth below:
Asset Category 2003 2002
Equity securities 65% 62%
Debt securities 30% 37%
Cash 5% 1%
Total 100% 100%
Our primary objectives regarding the pension assets are to
optimize return on assets subject to acceptable risk and
to maintain liquidity, meet minimum funding requirements
and minimize plan expenses. To achieve these objectives
we have adopted a passive investment strategy in which
the asset performance is driven primarily by the investment
allocation. Our target investment allocation is 70% equity
securities and 30% debt securities, consisting primarily
of low cost index mutual funds that track several sub-
categories of equity and debt security performance. The
investment strategy is primarily driven by lower participant
ages and reflects a long-term investment horizon favoring a
higher equity component in the investment allocation.
A mutual fund held as an investment by the pension
plan includes YUM stock in the amounts of $0.2 million and
$0.1 million at September 30, 2003 and 2002 (less than
1% of total plan assets in each instance).
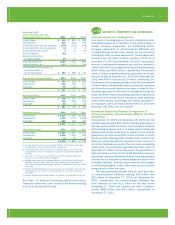
STOCK-BASED EMPLOYEE COMPENSATION
note
18
At year-end 2003, we had four stock option plans in effect:
the YUM! Brands, Inc. Long-Term Incentive Plan (“1999
LTIP”), the 1997 Long-Term Incentive Plan (“1997 LTIP”), the
YUM! Brands, Inc. Restaurant General Manager Stock Option
Plan (“RGM Plan”) and the YUM! Brands, Inc. SharePower
Plan (“SharePower”). During 2003, the 1999 LTIP was
amended, subsequent to shareholder approval, to increase
the total number of shares available for issuance and to
make certain other technical and clarifying changes.
We may grant awards of up to 29.8 million shares
and 45.0 million shares of stock under the 1999 LTIP, as
amended, and 1997 LTIP, respectively. Potential awards to
employees and non-employee directors under the 1999 LTIP
include stock options, incentive stock options, stock appre-
ciation rights, restricted stock, stock units, restricted stock
units, performance shares and performance units. Potential
awards to employees and non-employee directors under the
1997 LTIP include stock appreciation rights, restricted stock
and performance restricted stock units. Prior to January 1,
2002, we also could grant stock options and incentive stock
options under the 1997 LTIP. We have issued only stock
options and performance restricted stock units under the
1997 LTIP and have issued only stock options under the
1999 LTIP.
We may grant stock options under the 1999 LTIP to
purchase shares at a price equal to or greater than the
average market price of the stock on the date of grant.
New option grants under the 1999 LTIP can have varying
vesting provisions and exercise periods. Previously granted
options under the 1997 LTIP and 1999 LTIP vest in periods
ranging from immediate to 2007 and expire ten to fifteen
years after grant.
We may grant options to purchase up to 15.0 million
shares of stock under the RGM Plan at a price equal to or
greater than the average market price of the stock on the