Pentax 2006 Annual Report Download - page 68
Download and view the complete annual report
Please find page 68 of the 2006 Pentax annual report below. You can navigate through the pages in the report by either clicking on the pages listed below, or by using the keyword search tool below to find specific information within the annual report.-
 1
1 -
2
-
3
-
4
-
5
-
6
-
7
-
8
-
9
-
10
-
11
-
12
-
13
-
14
-
15
-
16
-
17
-
18
-
19
-
20
-
21
-
22
-
23
-
24
-
25
-
26
-
27
-
28
-
29
-
30
-
31
-
32
-
33
-
34
-
35
-
36
-
37
-
38
-
39
-
40
-
41
-
42
-
43
-
44
-
45
-
46
-
47
-
48
-
49
-
50
-
51
-
52
-
53
-
54
-
55
-
56
-
57
-
 58
58 -
 59
59 -
 60
60 -
 61
61 -
 62
62 -
 63
63 -
 64
64 -
 65
65 -
 66
66 -
 67
67 -
 68
68 -
 69
69 -
 70
70 -
 71
71 -
 72
72 -
 73
73 -
 74
74 -
 75
75 -
 76
76 -
 77
77
 |
 |

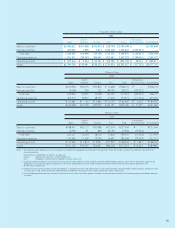
Thousands of U.S. Dollars
2006
North Eliminations
Japan America Europe Asia Total and Corporate Consolidated
Sales to customers $2,085,622 $301,958 $333,974 $ 208,794 $2,930,348 $ — $2,930,348
Interarea transfers 203,465 1,890 5,814 1,028,458 1,239,627 (1,239,627) —
Total sales 2,289,087 303,848 339,788 1,237,252 4,169,975 (1,239,627) 2,930,348
Operating expenses 1,961,471 294,594 284,047 827,667 3,367,779 (1,298,042) 2,069,737
Operating income $327,616 $ 9,254 $ 55,741 $ 409,585 $ 802,196 $ 58,415 $ 860,611
Assets $1,394,739 $190,491 $539,253 $1,270,954 $3,395,437 $ (317,732) $3,077,705
Millions of Yen
2005
North Eliminations
Japan America Europe Asia Total and Corporate Consolidated
Sales to customers ¥230,946 ¥30,775 ¥33,803 ¥ 12,648 ¥308,172 ¥ — ¥308,172
Interarea transfers 19,048 200 255 89,749 109,252 (109,252) —
Total sales 249,994 30,975 34,058 102,397 417,424 (109,252) 308,172
Operating expenses 204,413 30,912 28,195 71,004 334,524 (111,272) 223,252
Operating income ¥ 45,581 ¥ 63 ¥ 5,863 ¥ 31,393 ¥ 82,900 ¥ 2,020 ¥ 84,920
Assets ¥165,938 ¥17,129 ¥32,927 ¥104,191 ¥320,185 ¥ 31,297 ¥351,482
Millions of Yen
2004
North Eliminations
Japan America Europe Asia Total and Corporate Consolidated
Sales to customers ¥188,441 ¥33,113 ¥37,486 ¥12,404 ¥271,444 ¥ — ¥271,444
Interarea transfers 16,790 91 849 60,196 77,926 (77,926) —
Total sales 205,231 33,204 38,335 72,600 349,370 (77,926) 271,444
Operating expenses 167,669 31,390 29,294 54,693 283,046 (79,769) 203,277
Operating income ¥ 37,562 ¥ 1,814 ¥ 9,041 ¥17,907 ¥ 66,324 ¥ 1,843 ¥ 68,167
Assets ¥161,336 ¥19,059 ¥26,691 ¥66,338 ¥273,424 ¥ 16,463 ¥289,887
Notes: 1. The Company and subsidiaries are summarized in four segments by geographic area based on the countries where the Group is located. The segments consisted of the
following countries:
North America: United States of America, Canada, etc.
Europe: Netherlands, Germany, United Kingdom, etc.
Asia: Singapore, Thailand, China, Republic of Korea, Taiwan, etc.
2. Corporate operating expenses consist primarily of the administration expenses of the Company and one foreign holding company, which are not allocated to segments by
geographic area. Corporate operating expenses for the years ended March 31, 2006, 2005 and 2004 were ¥2,317 million ($19,724 thousand), ¥2,562 million and
¥2,074 million, respectively.
3. Corporate assets consist primarily of cash, time deposits, investment securities and administrative assets of the Company and one foreign holding company. Corporate assets
as of March 31, 2006, 2005 and 2004 were ¥33,959 million ($289,087 thousand), ¥72,841 million and ¥47,511 million, respectively.
4. Consolidated operating expenses are equal to the total of cost of sales and selling, general and administrative expenses shown in the accompanying consolidated statements
of income.