Pentax 2006 Annual Report Download - page 3
Download and view the complete annual report
Please find page 3 of the 2006 Pentax annual report below. You can navigate through the pages in the report by either clicking on the pages listed below, or by using the keyword search tool below to find specific information within the annual report.-
 1
1 -
 2
2 -
 3
3 -
 4
4 -
 5
5 -
 6
6 -
 7
7 -
 8
8 -
 9
9 -
 10
10 -
 11
11 -
 12
12 -
 13
13 -
 14
14 -
15
-
16
-
17
-
18
-
19
-
20
-
21
-
22
-
23
-
24
-
25
-
26
-
27
-
28
-
29
-
30
-
31
-
32
-
33
-
34
-
35
-
36
-
37
-
38
-
39
-
40
-
41
-
42
-
43
-
44
-
45
-
46
-
47
-
48
-
49
-
50
-
51
-
52
-
53
-
54
-
55
-
56
-
57
-
58
-
59
-
60
-
61
-
62
-
63
-
64
-
65
-
66
-
67
-
68
-
69
-
70
-
71
-
72
-
73
-
74
-
75
-
76
-
77
 |
 |

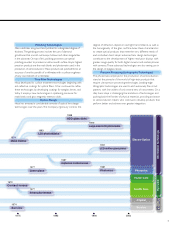
Contents
A Message to Our Stakeholders
Hoya s Technological Strengths
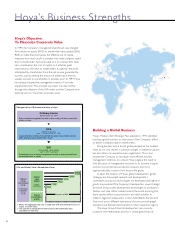
Hoya s Business Strengths
Hoya at a Glance
Information Technology
Electro-Optics Division
Photonics Division
Eye Care
Vision Care Division
Health Care Division
Other Businesses
Crystal Division
R&D and New Businesses
Corporate Governance
Corporate Social Responsibility
Environmental Initiatives
Financial Section and Corporate Data
2
6
8
10
12
13
17
18
19
21
23
23
24
26
27
28
29
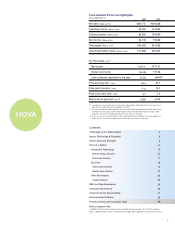
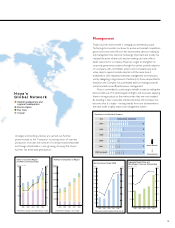
Consolidated Financial Highlights
Net sales Millions of Yen
Operating income Millions of Yen
Ordinary income Millions of Yen
Net income Millions of Yen
Total assets Millions of Yen
Total shareholders equity Millions of Yen
Per share data Yen
1
Net income
Diluted net income
Cash dividends applicable to the year
Price earnings ratio
Times
Price cash flow ratio Times
Price book value ratio Times
Stock price at year-end Yen
3
2005
·308,172
84,920
89,525
64,135
351,482
277,889
·144.71
144.38
37.50
20.4
17.2
4.7
2,950
2006
¥344,228
101,096
103,638
75,620
361,538
279,481
¥171.71
171.08
60.00
2
27.7
19.7
7.3
4,750
Years ended March 31
Note on segment data:
In addition to the review of operations by segment found on pages 10 to 23 of this annual
report, segment-specific data can be found on pages 32 through 43, in the financial section.
*1. Indicates per share data are all retroactive adjustments reflecting the four for one share
split that was effective from November 15, 2005.
*2. The cash dividend of ¥60 indicates the sum of the ¥30 year-end dividend per share, and
the ¥30 retroactive adjustment reflecting the share split implemented November 2005
relating to the interim dividend (¥120 per share) prior to the split.
*3. The stock price at year-end reflects the share split that was effective from November 15,
2005, and is a retroactive adjustment of the stock price prior to the split.