Pentax 2006 Annual Report Download - page 37
Download and view the complete annual report
Please find page 37 of the 2006 Pentax annual report below. You can navigate through the pages in the report by either clicking on the pages listed below, or by using the keyword search tool below to find specific information within the annual report.-
 1
1 -
2
-
3
-
4
-
5
-
6
-
7
-
8
-
9
-
10
-
11
-
12
-
13
-
14
-
15
-
16
-
17
-
18
-
19
-
20
-
21
-
22
-
23
-
24
-
25
-
26
-
 27
27 -
 28
28 -
 29
29 -
 30
30 -
 31
31 -
 32
32 -
 33
33 -
 34
34 -
 35
35 -
 36
36 -
 37
37 -
 38
38 -
 39
39 -
 40
40 -
 41
41 -
 42
42 -
 43
43 -
 44
44 -
 45
45 -
 46
46 -
 47
47 -
48
-
49
-
50
-
51
-
52
-
53
-
54
-
55
-
56
-
57
-
58
-
59
-
60
-
61
-
62
-
63
-
64
-
65
-
66
-
67
-
68
-
69
-
70
-
71
-
72
-
73
-
74
-
75
-
76
-
77
 |
 |
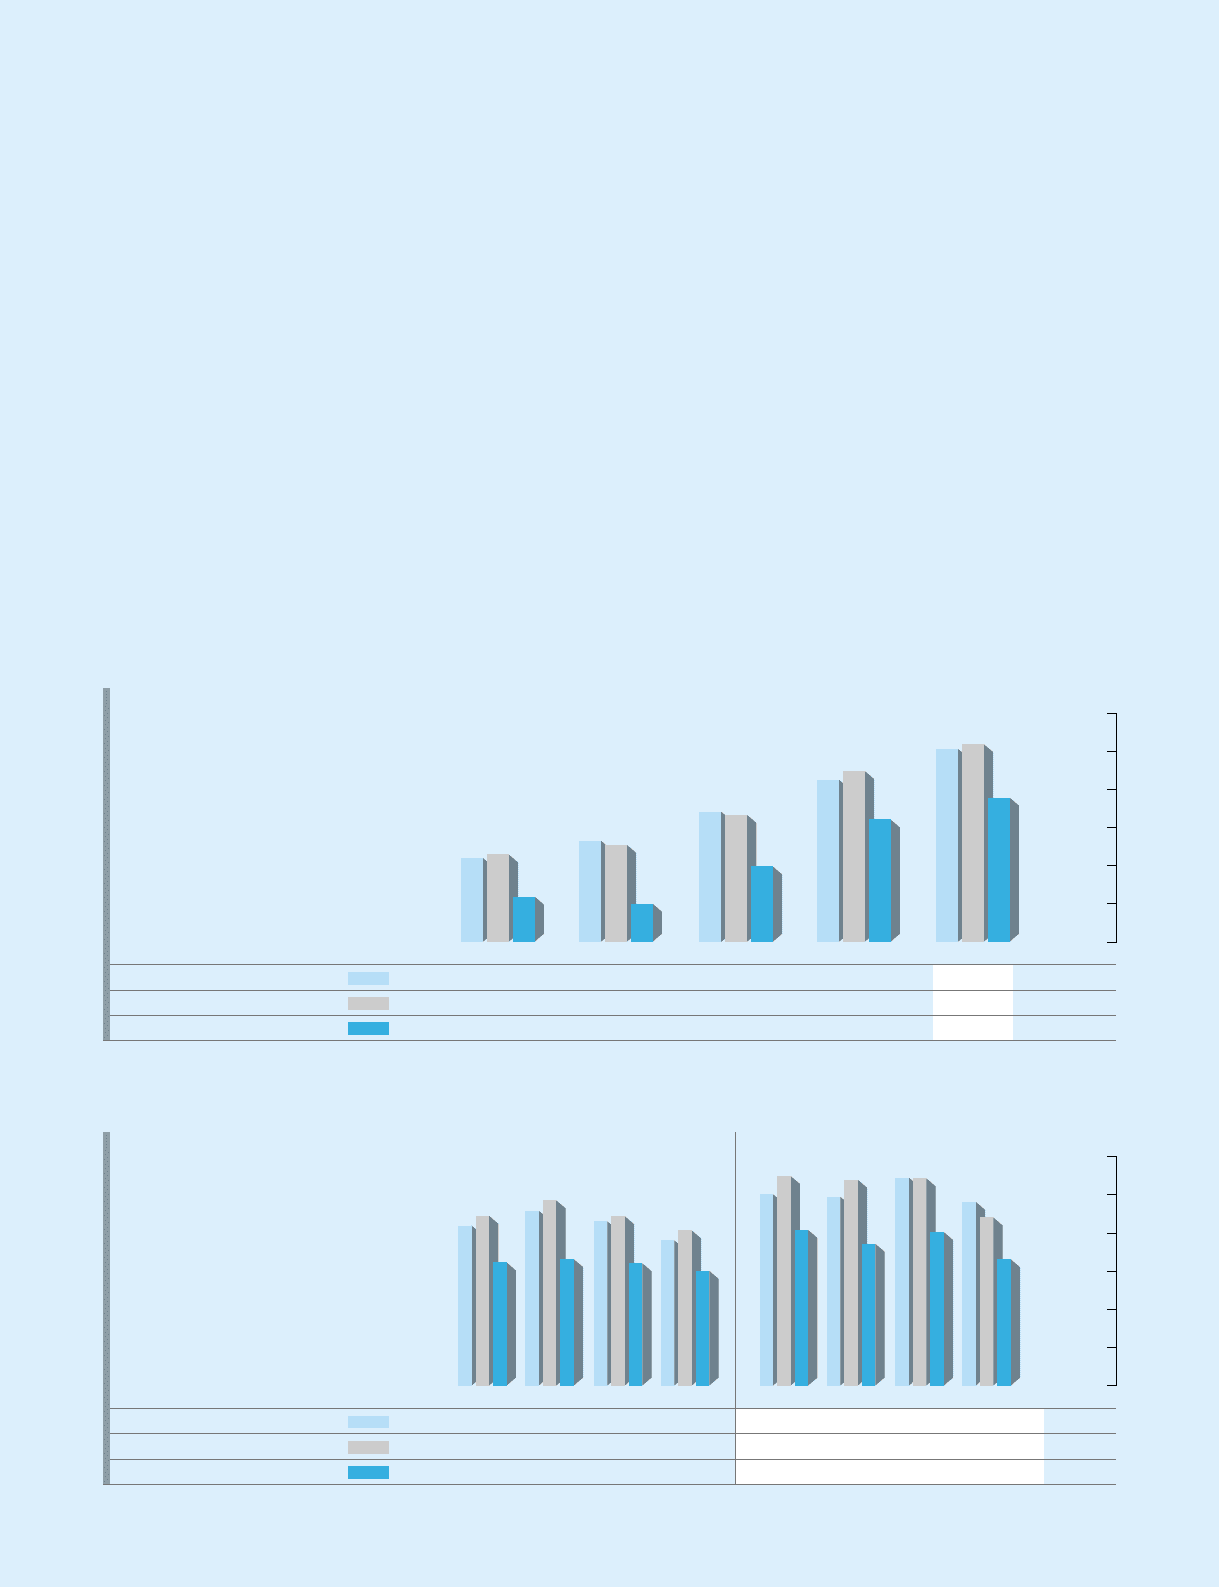
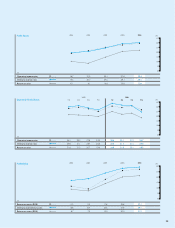
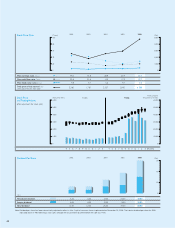
Operating Income,
Ordinary Income and Net Income
(Millions of yen)
120,000
100,000
80,000
60,000
40,000
20,000
0
2002 2003 2004 2005 2006
Operating income
Ordinary income
Net income
43,898
45,774
23,741
52,983
50,874
20,038
68,167
66,554
39,549
84,920
89,525
64,135
101,096
103,638
75,620
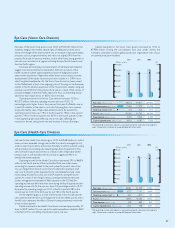
Quarterly Profits (Millions of yen)
30,000
25,000
20,000
15,000
10,000
5,000
0
1Q 2Q 3Q
2005
4Q 1Q 2Q 3Q
2006
4Q
Operating income
Ordinary income
Net income
21,082
22,366
16,223
23,047
24,405
16,671
21,652
22,314
16,123
19,139
20,440
15,118
25,056
27,466
20,389
24,740
26,974
18,596
27,257
27,161
20,120
24,043
22,037
16,515
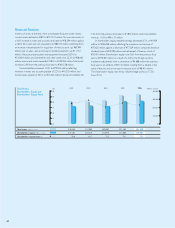
Net Income
As net sales expanded, the cost of sales also rose, increasing 8.9% year
on year to ¥172,034 million. Because cost of sales grew less than net
sales, which increased 11.7%, the gross profit margin improved to 50.0%,
up 1.3 percentage points from 48.7% in the previous fiscal year. Selling,
general and administrative (SG&A) expenses also rose with the growth
in net sales, increasing 9.0% to ¥71,098 million. SG&A expenses as a
percentage of net sales, however, declined 0.4 percentage point, from
21.1% to 20.7%, because SG&A expenses rose at a lower pace than the
growth rate for net sales. As a result, operating income increased 19.0%
to ¥101,096 million, and the operating income ratio improved by 1.8
percentage points to 29.4%. By quarter, the operating income ratio was
30.6% in the first quarter, 29.1% in the second quarter, 31.2% in the
third quarter and 26.7% in the fourth quarter.
Net income for the consolidated fiscal year under review increased
17.9% to ¥75,620, despite contraction in other income such factors as a
fall in equity in earnings of associated companies of ¥2,423 million from
the previous fiscal year and a decline in foreign exchange gains (losses),
from ¥875 million in the previous year to ¥243 million. There were
otherwise increase of ¥1,746 million for loss on clarification of soil
pollution and ¥374 million for impairment losses, although declines of
¥323 million in loss on disposal of property, plant and equipment, and
¥741 million in loss on plant closure from the ¥1,264 million due to
significant restructuring generated in the previous year.
Return on assets (ROA) improved by 1.2 percentage points to
21.2%, and return on equity (ROE) improved by 1.3 percentage points
to 27.1%. Dividends for the consolidated fiscal year under review
consisted of an interim dividend of ¥120 per share and a year-end
dividend of ¥30 per share, for an aggregate ¥150 per share for the full
year. If the interim dividend is adjusted retroactively to reflect the 4-for-1
stock split implemented in November 2005, the dividend payment for
the full year amounts to ¥60 per share (¥120 ÷ 4 + ¥30 = ¥60), a 60%
increase from previous year’s dividend of ¥37.5 per share.
(Millions of yen)
(Millions of yen)