Pentax 2006 Annual Report Download - page 39
Download and view the complete annual report
Please find page 39 of the 2006 Pentax annual report below. You can navigate through the pages in the report by either clicking on the pages listed below, or by using the keyword search tool below to find specific information within the annual report.-
 1
1 -
2
-
3
-
4
-
5
-
6
-
7
-
8
-
9
-
10
-
11
-
12
-
13
-
14
-
15
-
16
-
17
-
18
-
19
-
20
-
21
-
22
-
23
-
24
-
25
-
26
-
27
-
28
-
 29
29 -
 30
30 -
 31
31 -
 32
32 -
 33
33 -
 34
34 -
 35
35 -
 36
36 -
 37
37 -
 38
38 -
 39
39 -
 40
40 -
 41
41 -
 42
42 -
 43
43 -
 44
44 -
 45
45 -
 46
46 -
 47
47 -
 48
48 -
 49
49 -
50
-
51
-
52
-
53
-
54
-
55
-
56
-
57
-
58
-
59
-
60
-
61
-
62
-
63
-
64
-
65
-
66
-
67
-
68
-
69
-
70
-
71
-
72
-
73
-
74
-
75
-
76
-
77
 |
 |
(%)
40
20
0
(Millions of yen)
200,000
150,000
100,000
50,000
0
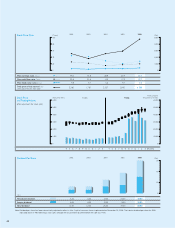
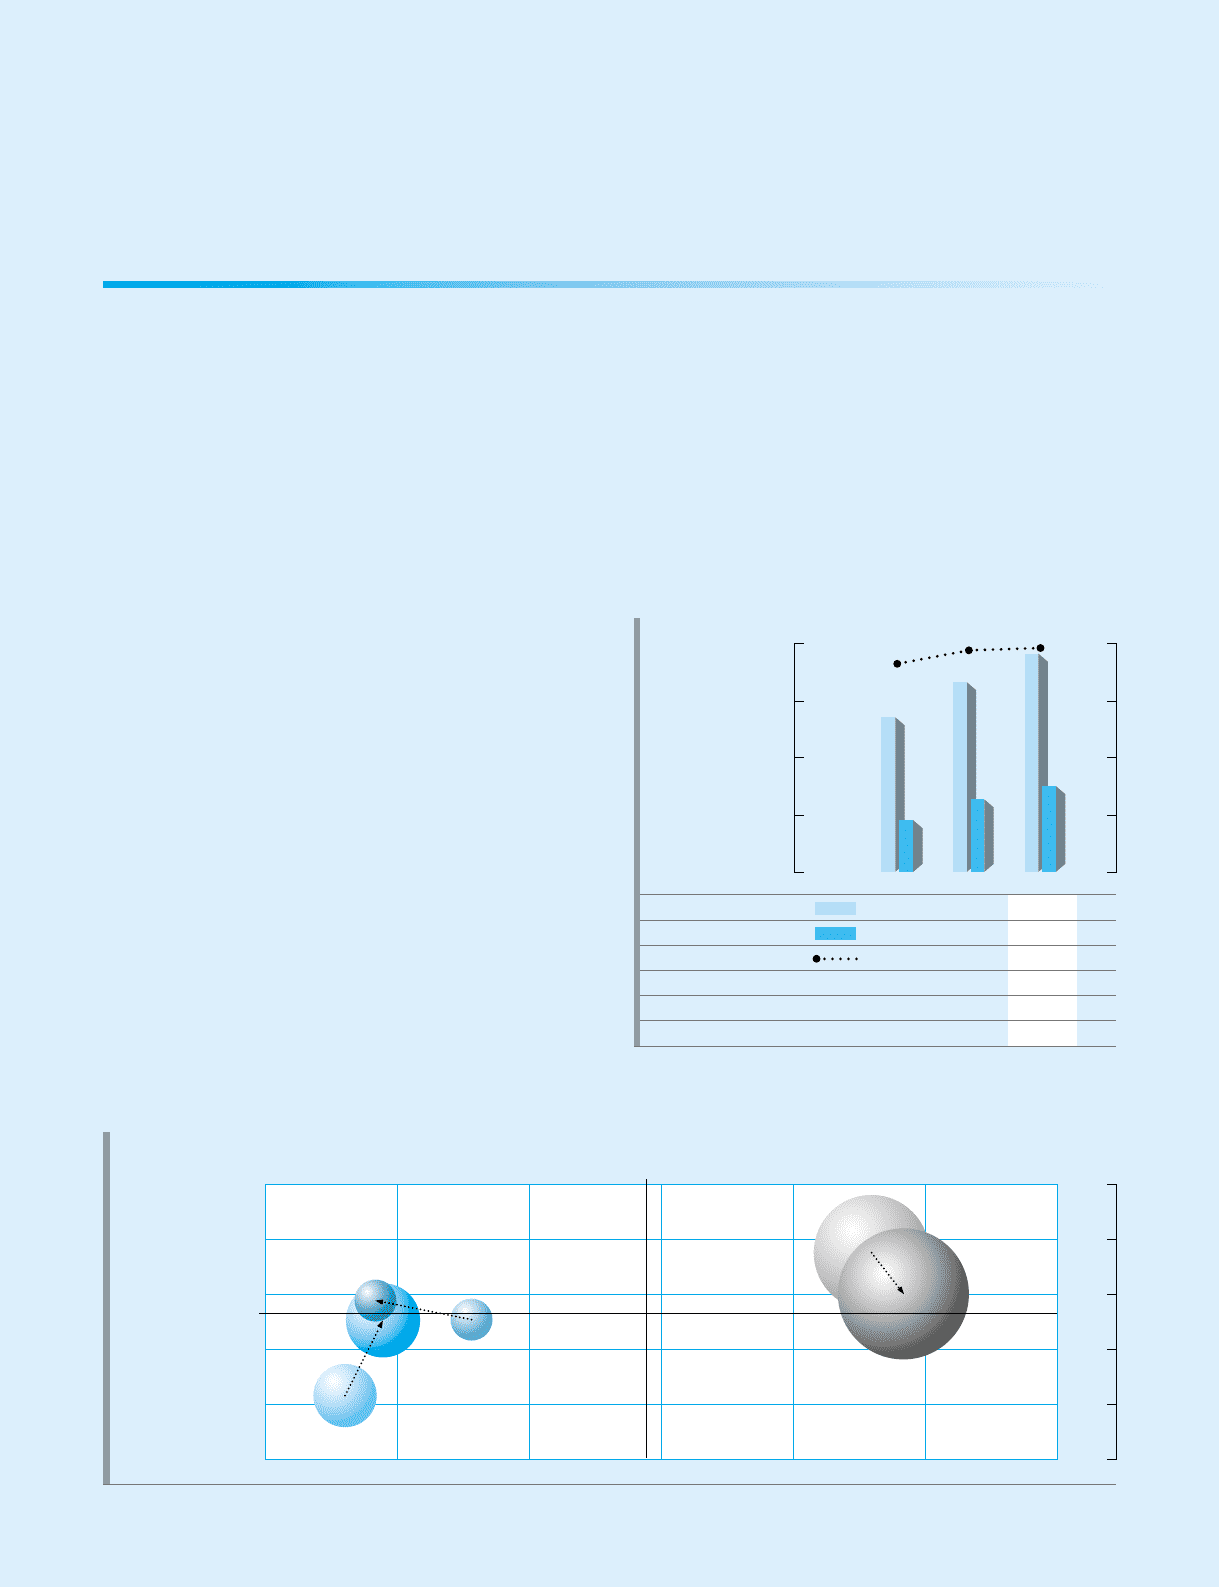
Net sales (Millions of yen)
Operating income (Millions of yen)
Operating income ratio* (%)
Assets (Millions of yen)
Depreciation (Millions of yen)
Capital expenditures (Millions of yen)
135,071
45,170
33.4
132,240
13,205
22,247
165,664
63,290
38.1
162,638
14,730
31,962
190,552
74,862
39.1
204,192
18,716
37,244
Sales Growth and Profitability of Main Business Segments
Fiscal year ended March 31, 2006 (Compared with the previous fiscal year) Sales Growth Ratio (%)
35
25
15
5
-5
-15
15202530354045
* The operating income ratio above is calculated using net sales plus intersegment
sales. Please refer to details on page 62 Segment Information.
Electro-Optics Division
Operating Income Ratio (%)
Consolidated Basis
Consolidated Basis
Size of circle shows the volume of operating income.
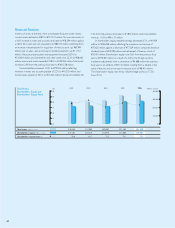
Net sales in the Electro-Optics division rose 15.0% year on year to
¥190,552 million. In mask blanks for semiconductor production, demand
was strong for high-precision products such as phase shift mask blanks in
response to greater functionality and higher capacity of LSIs. There was an
increase in orders for photomasks for semiconductor production, mainly
high-end products that comply with 65-nm line width design rules, though
sales remained flat overall as a result of a special order for ordinary class
products during the previous fiscal year. In photomasks for LCD panels, the
Group benefited from increased production capacity owing to the opening
of a new production facility, and demand was strong for leading-edge,
large-scale masks as a result of the establishment of highly active, new
production lines, and the development of new models by many
panel manufacturers.
In glass disks for HDDs, although demand for applications such as
portable music players slowed from the middle of the year, demand for
disks for laptop computers expanded strongly. Net sales also rose steadily
as a result of the start of production at a new plant, and investment aimed
at increasing production at existing plants. In optical glass products,
inventory adjustments in the digital camera market that began in the
second half of the previous year were completed. Sales rose from the
previous fiscal year as a result of increased demand for lenses for digital
cameras (mainly products with high degrees of added value), and the full-
scale start of shipments of camera lenses for new applications such as
mobile phones.
Operating income in the Electro-Optics division rose 18.3% to
¥74,862 million. In the first half, demand exceeded supply capacity for many
products, boosting profit margins to high levels because plant capacity
utilization rates were high. In the second half, supply capacity was filled as a
result of the benefit of investment in increased production, although profit
margins eroded due to such factors as the surfacing of price competition
for certain products, and changes in the product mix. Demand for all
products remained strong, however, and the operating income ratio for the
full year rose by 1.0 percentage point to 39.1%. By quarter, the operating
income ratio was 42.0% in the first quarter, 38.3% in the second quarter,
39.8% in the third quarter and 36.8% in the fourth quarter.
As indicated in the graph for “Sales Growth and Profitability of Main
Business Segments” (“the segment graph”), the net sales growth rate in
the Electro-Optics division was higher than the consolidated average
growth rate for net sales of 11.7% (the circle is above the Consolidated
Basis line), and the operating income ratio rose from the previous
consolidated fiscal year (the circle shifted to the right).
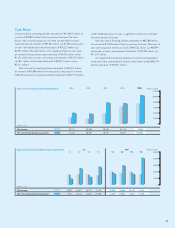
Capital investment in the Electro-Optics division rose 16.5% to
¥37,244 million, due mainly to the establishment of a new large-scale LCD
photomask plant in South Korea, a new HDD glass disk plant in Vietnam,
and proactive investments to increase production capacity at existing
plants, such as those for optical lenses.
Net sales for the Photonics division fell 6.1% to ¥10,093 million from
the previous fiscal year. Operating income rose 4.6% to ¥934 million, and
the operating income ratio improved 0.9 percentage point to 9.0%.
Although net sales declined as a result of a reshuffling of the product mix
in favor of more profitable products, earnings rose due to the
strengthening of the marketing structure and greater efficiency in the
production structure.
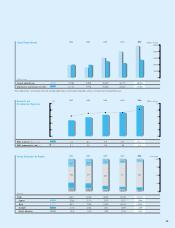
Segment Overview
Information Technology (Electro-Optics and Photonics Division)
Health Care
Vision Care
2004 2005 2006
Electro-Optics