Pentax 2006 Annual Report Download - page 65
Download and view the complete annual report
Please find page 65 of the 2006 Pentax annual report below. You can navigate through the pages in the report by either clicking on the pages listed below, or by using the keyword search tool below to find specific information within the annual report.-
 1
1 -
2
-
3
-
4
-
5
-
6
-
7
-
8
-
9
-
10
-
11
-
12
-
13
-
14
-
15
-
16
-
17
-
18
-
19
-
20
-
21
-
22
-
23
-
24
-
25
-
26
-
27
-
28
-
29
-
30
-
31
-
32
-
33
-
34
-
35
-
36
-
37
-
38
-
39
-
40
-
41
-
42
-
43
-
44
-
45
-
46
-
47
-
48
-
49
-
50
-
51
-
52
-
53
-
54
-
 55
55 -
 56
56 -
 57
57 -
 58
58 -
 59
59 -
 60
60 -
 61
61 -
 62
62 -
 63
63 -
 64
64 -
 65
65 -
 66
66 -
 67
67 -
 68
68 -
 69
69 -
 70
70 -
 71
71 -
 72
72 -
 73
73 -
 74
74 -
 75
75 -
76
-
77
 |
 |
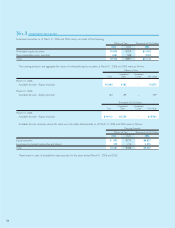
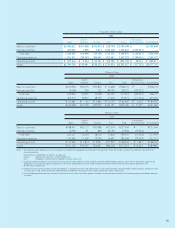
Information about industry segments, geographical segments and sales to foreign customers of the Company and subsidiaries for the years
ended March 31, 2006, 2005 and 2004 was as follows:
(1) Industry Segments
a. Sales and Operating Income
Millions of Yen
2006
Information Lifestyle
Technology Eye Care Refinement
Vision Health Eliminations
Electro-Optics Photonics Care Care Crystal Service Total and Corporate Consolidated
Sales to customers ¥190,552 ¥10,093 ¥104,457 ¥35,484 ¥1,864 ¥1,778 ¥344,228 ¥ — ¥344,228
Intersegment sales 744 246 1 0 33 4,333 5,357 (5,357) —
Total sales 191,296 10,339 104,458 35,484 1,897 6,111 349,585 (5,357) 344,228
Operating expenses 116,434 9,405 84,088 28,625 2,052 5,464 246,068 (2,936) 243,132
Operating income (loss) ¥ 74,862 ¥ 934 ¥ 20,370 ¥ 6,859 ¥ (155) ¥ 647 ¥103,517 ¥(2,421) ¥101,096
b. Assets, Depreciation, Loss on Impairment of Long-Lived Assets and Capital Expenditures
Millions of Yen
2006
Information Lifestyle
Technology Eye Care Refinement
Vision Health Eliminations
Electro-Optics Photonics Care Care Crystal Service Total and Corporate Consolidated
Assets ¥204,192 ¥7,606 ¥98,243 ¥19,927 ¥840 ¥3,984 ¥334,792 ¥26,746 ¥361,538
Depreciation 18,716 109 6,444 855 — 53 26,177 75 26,252
Impairment loss —— ——864 — 864 369 1,233
Capital expenditures 37,244 208 7,958 2,391 762 160 48,723 63 48,786
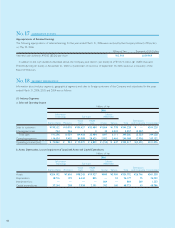
No. 18 SEGMENT INFORMATION
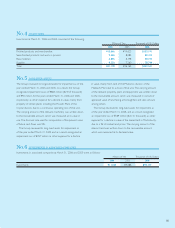
Appropriations of Retained Earnings
The following appropriations of retained earnings for the year ended March 31, 2006 were resolved by the Company’s Board of Directors
on May 25, 2006:
Millions of Yen Thousands of U.S. Dollars
Year-end cash dividends, ¥30.00 ($0.26) per share ¥12,918 $109,969
No. 17 SUBSEQUENT EVENTS
In addition to the cash dividends described above, the Company paid interim cash dividends of ¥13,374 million ($113,850 thousand,
¥120.00 ($1.02) per share) on November 21, 2005 to shareholders of record as of September 30, 2005, based on a resolution of the
Board of Directors.