Pentax 2006 Annual Report Download - page 36
Download and view the complete annual report
Please find page 36 of the 2006 Pentax annual report below. You can navigate through the pages in the report by either clicking on the pages listed below, or by using the keyword search tool below to find specific information within the annual report.-
 1
1 -
2
-
3
-
4
-
5
-
6
-
7
-
8
-
9
-
10
-
11
-
12
-
13
-
14
-
15
-
16
-
17
-
18
-
19
-
20
-
21
-
22
-
23
-
24
-
25
-
 26
26 -
 27
27 -
 28
28 -
 29
29 -
 30
30 -
 31
31 -
 32
32 -
 33
33 -
 34
34 -
 35
35 -
 36
36 -
 37
37 -
 38
38 -
 39
39 -
 40
40 -
 41
41 -
 42
42 -
 43
43 -
 44
44 -
 45
45 -
 46
46 -
47
-
48
-
49
-
50
-
51
-
52
-
53
-
54
-
55
-
56
-
57
-
58
-
59
-
60
-
61
-
62
-
63
-
64
-
65
-
66
-
67
-
68
-
69
-
70
-
71
-
72
-
73
-
74
-
75
-
76
-
77
 |
 |
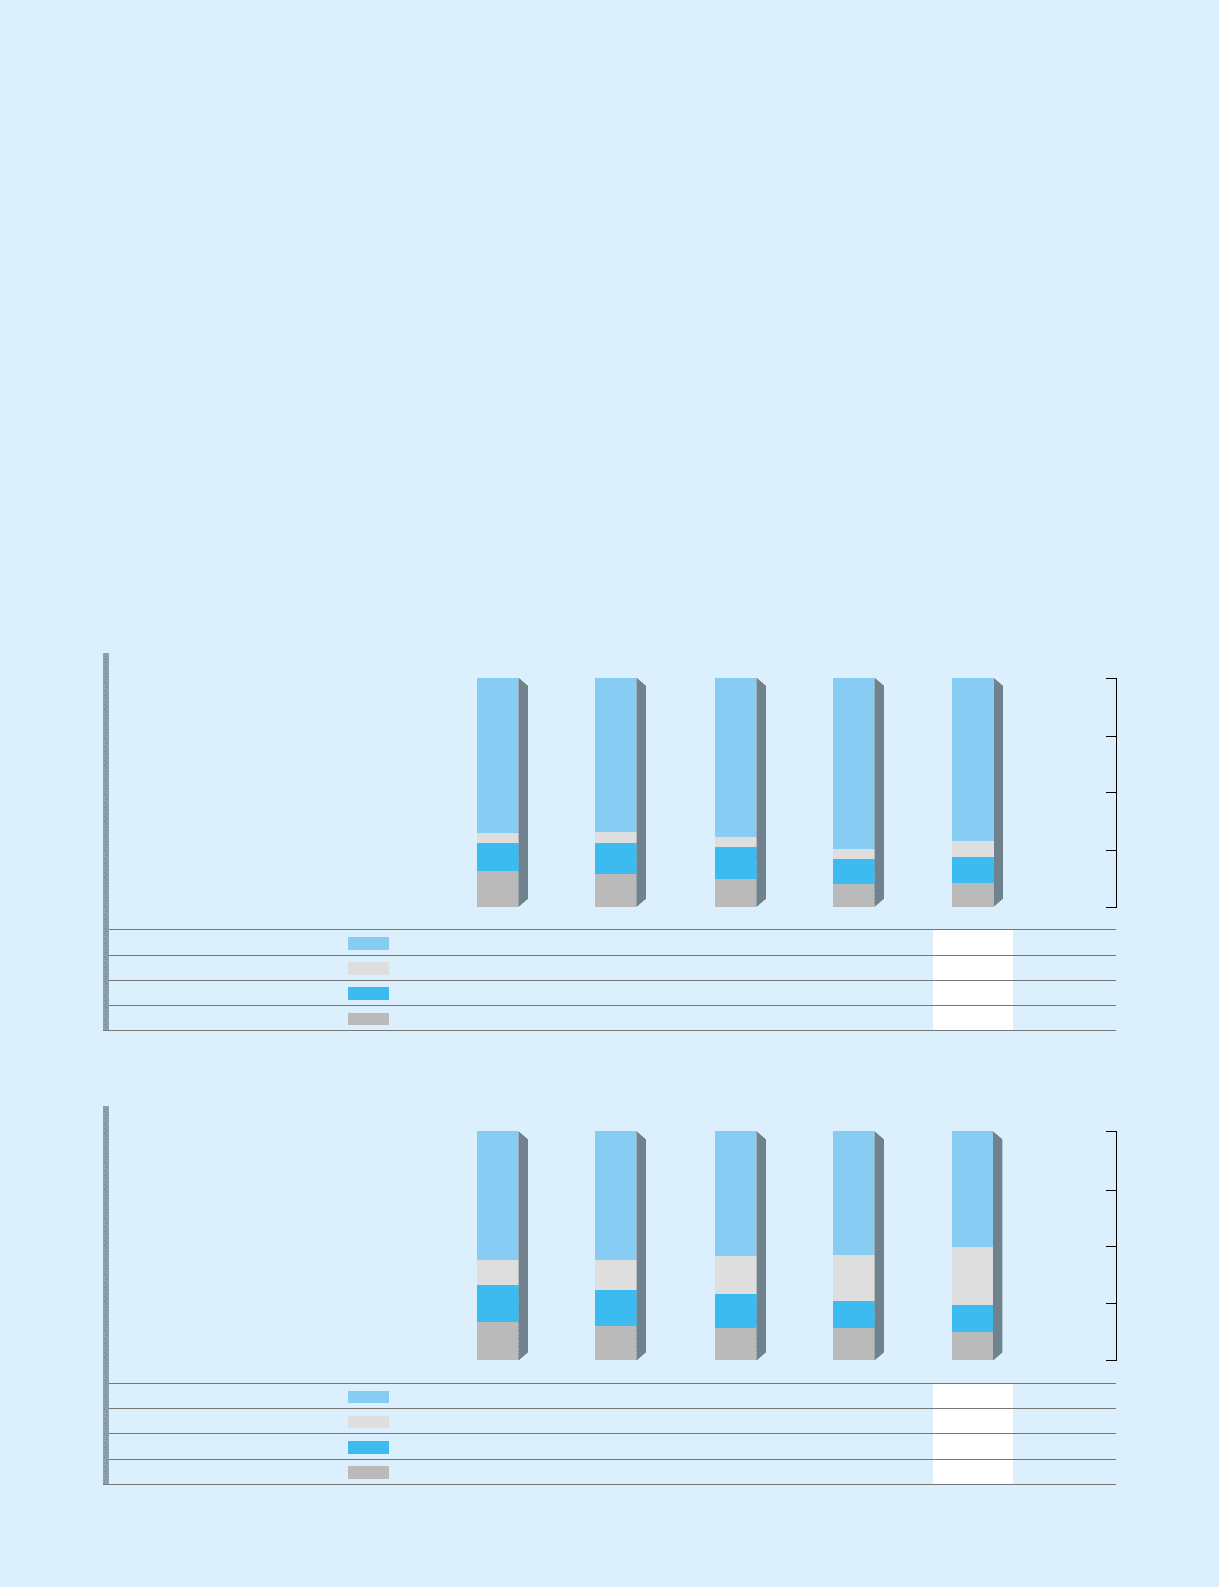
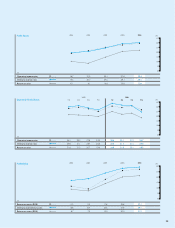
Sales by Region
(Based on the location of the Company’s offices)
(% of total)
100
75
50
25
0
2002 2003 2004 2005 2006
Japan
Asia
Europe
North America
159,368
9,948
28,964
36,985
166,178
11,705
32,639
35,771
188,441
12,404
37,486
33,113
230,946
12,648
33,803
30,775
244,998
24,527
39,232
35,471
67.8
4.2
12.3
15.7
67.5
4.8
13.2
14.5
69.4
4.6
13.8
12.2
74.9
4.1
11.0
10.0
Sales to Domestic and Foreign Customers
(Based on the location of customers)
(% of total)
100
75
50
25
0
2002 2003 2004 2005 2006
Japan
Asia and Other Areas
Europe
North America
132,248
25,127
38,144
39,746
138,006
32,806
38,789
36,692
148,325
44,668
40,168
38,283
166,414
61,808
36,430
43,520
173,506
86,848
41,201
42,673
56.2
10.7
16.2
16.9
56.0
13.3
15.8
14.9
54.6
16.5
14.8
14.1
54.0
20.1
11.8
14.1
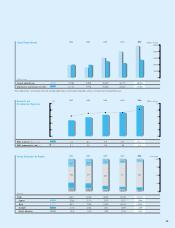
71.2
7.1
11.4
10.3
50.4
25.2
12.0
12.4
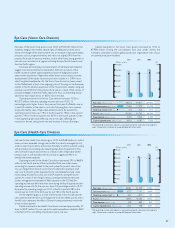
Technology field rose 15.0% year on year, net sales for the Vision Care
division in the Eye Care field increased 10.0%, and net sales for the
Health Care division rose 13.0%.
Regarding net sales by customer region, net sales to customers in
Japan increased 4.3% to ¥173,506 million, while net sales overseas grew
20.4% to ¥170,722 million. As a result, the composition of net sales was
50.4% domestic and 49.6% overseas. Domestic sales and overseas sales
in the previous fiscal year accounted for 54.0% and 46.0% of total net
sales, respectively, illustrating the rising proportion of overseas sales that
has continued from the prior consolidated fiscal year.
Hoya calculates the effect of exchange rates on operating results in
the consolidated fiscal year under review by comparing the foreign
currency denominated financial statements of its overseas subsidiaries,
when converted into yen at the average exchange rates during the
consolidated fiscal year under review, with the same statements when
converted into yen at the average exchange rates prevailing during the
previous fiscal year. In currency markets during the fiscal year, the yen
weakened 5.9% against the U.S. dollar to ¥113.93, 1.8% against the euro
to ¥138.13, and 4.9% against the Thai baht to ¥2.81. Because the yen fell
against all these main currencies, the operating results of Group
companies in the United States, Europe and Thailand swelled on an
exchange rate basis. Overall, the effect of exchange rates added ¥4,718
million to net sales and ¥2,650 million to net income.
(Millions of yen)
(Millions of yen)