Pentax 2006 Annual Report Download - page 43
Download and view the complete annual report
Please find page 43 of the 2006 Pentax annual report below. You can navigate through the pages in the report by either clicking on the pages listed below, or by using the keyword search tool below to find specific information within the annual report.-
 1
1 -
2
-
3
-
4
-
5
-
6
-
7
-
8
-
9
-
10
-
11
-
12
-
13
-
14
-
15
-
16
-
17
-
18
-
19
-
20
-
21
-
22
-
23
-
24
-
25
-
26
-
27
-
28
-
29
-
30
-
31
-
32
-
 33
33 -
 34
34 -
 35
35 -
 36
36 -
 37
37 -
 38
38 -
 39
39 -
 40
40 -
 41
41 -
 42
42 -
 43
43 -
 44
44 -
 45
45 -
 46
46 -
 47
47 -
 48
48 -
 49
49 -
 50
50 -
 51
51 -
 52
52 -
 53
53 -
54
-
55
-
56
-
57
-
58
-
59
-
60
-
61
-
62
-
63
-
64
-
65
-
66
-
67
-
68
-
69
-
70
-
71
-
72
-
73
-
74
-
75
-
76
-
77
 |
 |
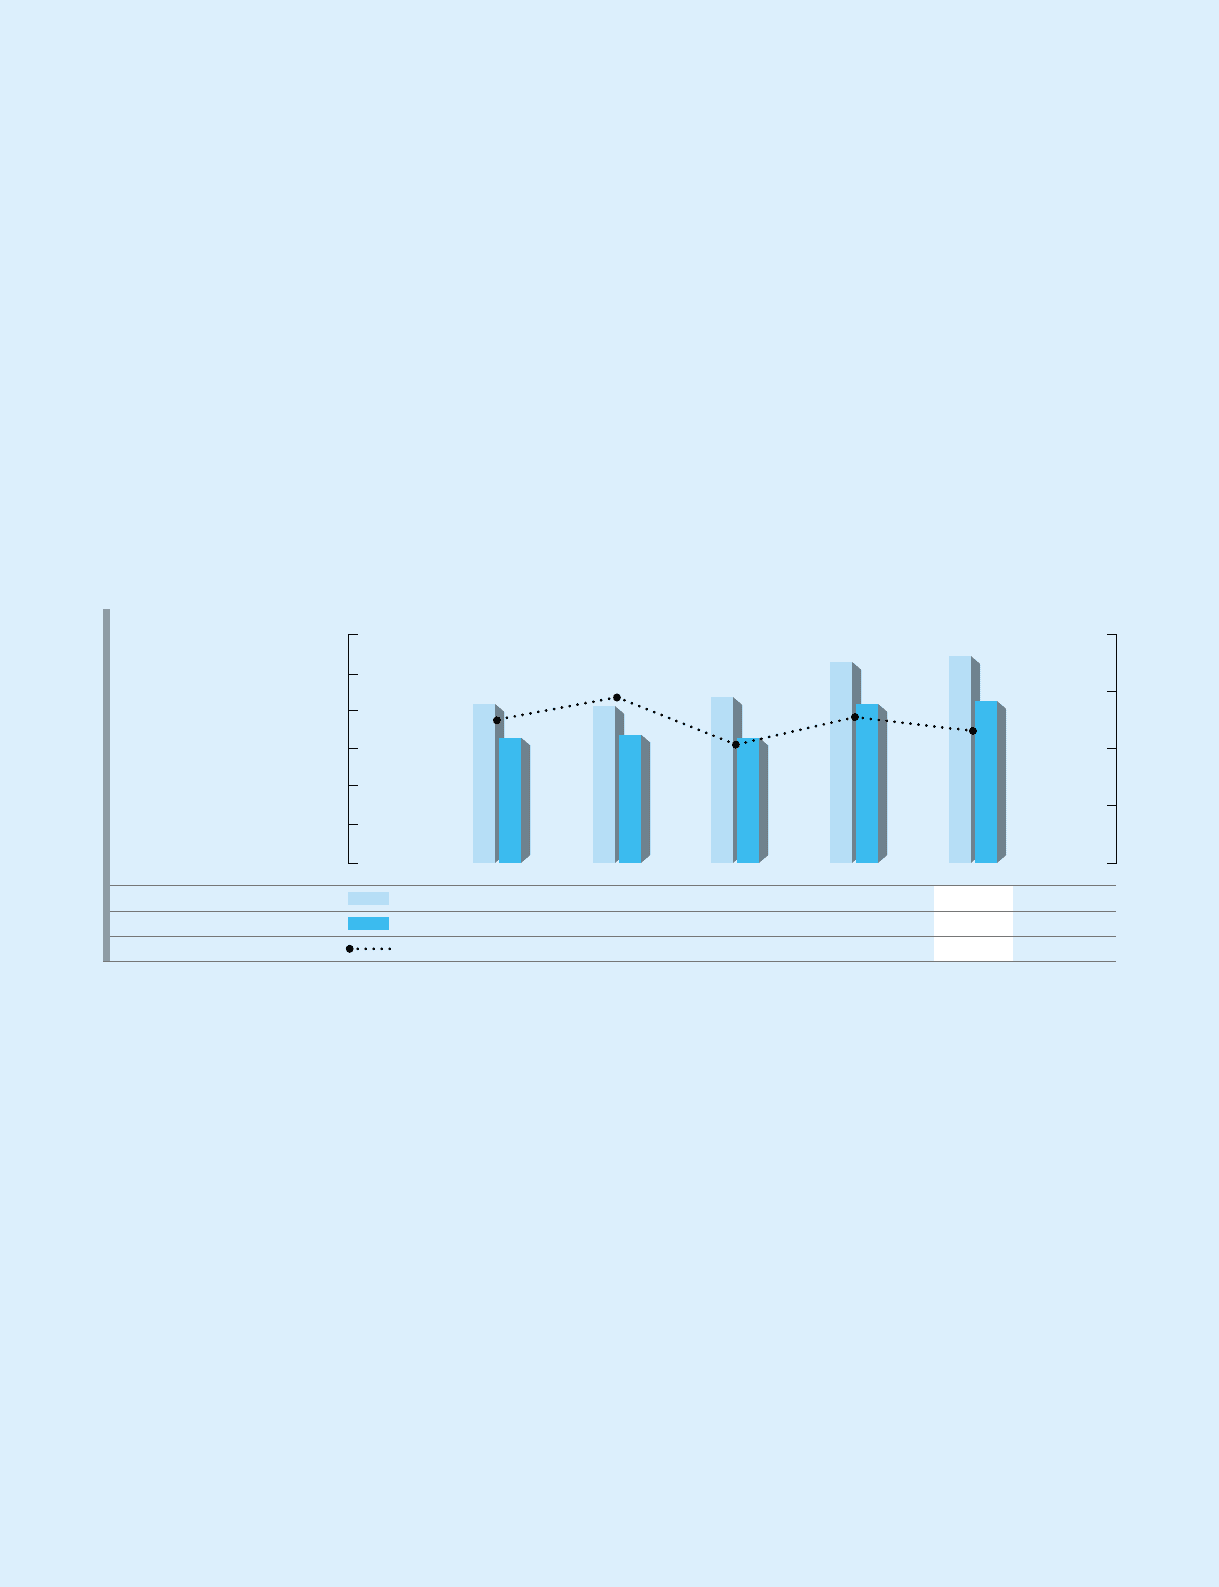
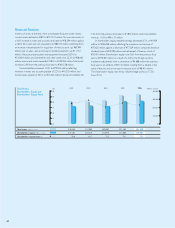
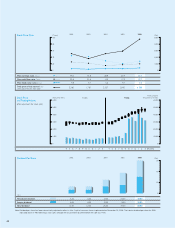
Total Assets,
Shareholders’ Equity and
Shareholders’ Equity Ratio
(Millions of yen)
400,000
300,000
200,000
100,000
0
(%)
90
85
80
75
70
65
60
2002 2003 2004 2005 2006
Total assets (Millions of yen)
Shareholders’ equity (Millions of yen)
Shareholders’ equity ratio (%)
278,068
219,180
78.8
274,289
224,219
81.7
289,887
218,979
75.5
351,482
277,889
79.1
361,538
279,481
77.3
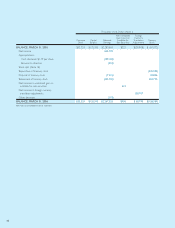
Financial Position
In terms of assets at the end of the consolidated fiscal year under review,
current assets declined by 8.8% to ¥212,274 million. This was due mainly to
a 4.0% increase in notes and accounts receivable to ¥78,294 million, against
a 26.0% fall in cash and cash equivalents to ¥83,574 million stemming from
an increase in expenditures for acquisition of treasury stock (up ¥63,994
million year on year), and an increase in dividend payments (up ¥11,157
million). Because property, plant and equipment increased 26.7% to
¥120,604 million, and investments and other assets rose 22.2% to ¥28,660
million, noncurrent assets expanded 25.8% to ¥149,264 million. Total assets
increased 2.9% from the previous fiscal year to ¥361,538 million.
Current liabilities increased 12.0% to ¥79,305 million, reflecting
increases in notes and accounts payable of 3.2% to ¥41,020 million, and
income taxes payable of 43.1% to ¥14,342 million. Noncurrent liabilities fell
7.0% from the previous fiscal year to ¥1,832 million, while total liabilities
were up 11.5% to ¥81,137 million.
In shareholders’ equity, retained earnings decreased 0.7%, or ¥1,909
million, to ¥266,346 million, reflecting the increase in net income of
¥75,620 million, against a decrease of ¥77,529 million composed mainly of
dividends paid of ¥23,398 million, and retirement of treasury stock of
¥53,181 million. Shareholders’ equity rose 0.6% from the previous fiscal
year to ¥279,481 million as a result of a shift in the foreign currency
translation adjustments from a subtraction of ¥4,688 million the previous
fiscal year to an addition of ¥7,142 million resulting from a decline in the
value of the yen, and an increase in treasury stock of ¥8,401 million.
The shareholders’ equity ratio fell by 1.8 percentage points, to 77.3%
from 79.1%.