Pentax 2006 Annual Report Download - page 40
Download and view the complete annual report
Please find page 40 of the 2006 Pentax annual report below. You can navigate through the pages in the report by either clicking on the pages listed below, or by using the keyword search tool below to find specific information within the annual report.-
 1
1 -
2
-
3
-
4
-
5
-
6
-
7
-
8
-
9
-
10
-
11
-
12
-
13
-
14
-
15
-
16
-
17
-
18
-
19
-
20
-
21
-
22
-
23
-
24
-
25
-
26
-
27
-
28
-
29
-
 30
30 -
 31
31 -
 32
32 -
 33
33 -
 34
34 -
 35
35 -
 36
36 -
 37
37 -
 38
38 -
 39
39 -
 40
40 -
 41
41 -
 42
42 -
 43
43 -
 44
44 -
 45
45 -
 46
46 -
 47
47 -
 48
48 -
 49
49 -
 50
50 -
51
-
52
-
53
-
54
-
55
-
56
-
57
-
58
-
59
-
60
-
61
-
62
-
63
-
64
-
65
-
66
-
67
-
68
-
69
-
70
-
71
-
72
-
73
-
74
-
75
-
76
-
77
 |
 |
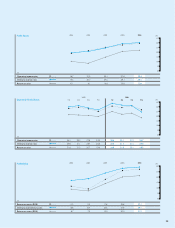
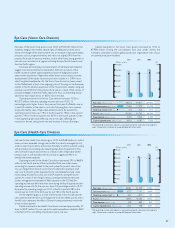
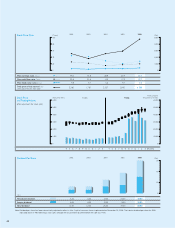
Net sales of the Vision Care division rose 10.0% to ¥104,457 million. In the
domestic eyeglass lens market, despite signs of deflationary trends and a
sense of shrinkage of the market, there was an increase in high-value-added
products such as progressive lenses, and sales rose slightly, 0.4% from the
previous fiscal year. In overseas markets, on the other hand, strong growth in
net sales was recorded in all regions, including Europe, North America and
the Asia-Pacific region.
In Europe, the Company’s principal market of Germany had remained
sluggish since the abolishment in December 2003 of a provision of the
health insurance system supporting the purchase of eyeglasses, but the
deep-rooted popularity of high-value-added lenses and recovery since the
abandonment of the health insurance provision resulted in a 15.9% rise in
sales. The global headquarters for the Vision Care division has been moved
to the Netherlands as part of an ongoing policy of focusing on the European
market. In North America, awareness of the Hoya brand is steadily rising, and
revenue rose 20.0% from the previous fiscal year as a result of the success of
product strategies. In the Asia-Pacific region, the focus on marketing activity
tailored to each region led to an 18.0% rise in net sales.
Operating income for the Vision Care division increased 19.3% to
¥20,370 million, while the operating income ratio was 19.5%, 1.5
percentage points higher than in the previous fiscal year. Profitability rose as
a result of a decline in the sales to cost ratio following the rise in revenue,
along with healthy sales of high-value-added products. By quarter, the
operating income ratio was 17.9% in the first quarter, 19.6% in the second
quarter, 21.9% in the third quarter and 18.7% in the fourth quarter. Circles
in the segment graph have shifted up and to the right, reflecting the
recovery in the net sales growth rate and increase in the profit margin.
Capital investment in the Vision Care division increased by 17.3% to
¥7,958 million. During the consolidated fiscal year under review, the
Company continued to build a global production organization with a focus
on optimal production locations.
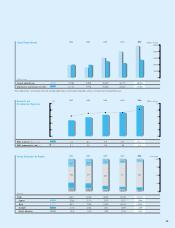
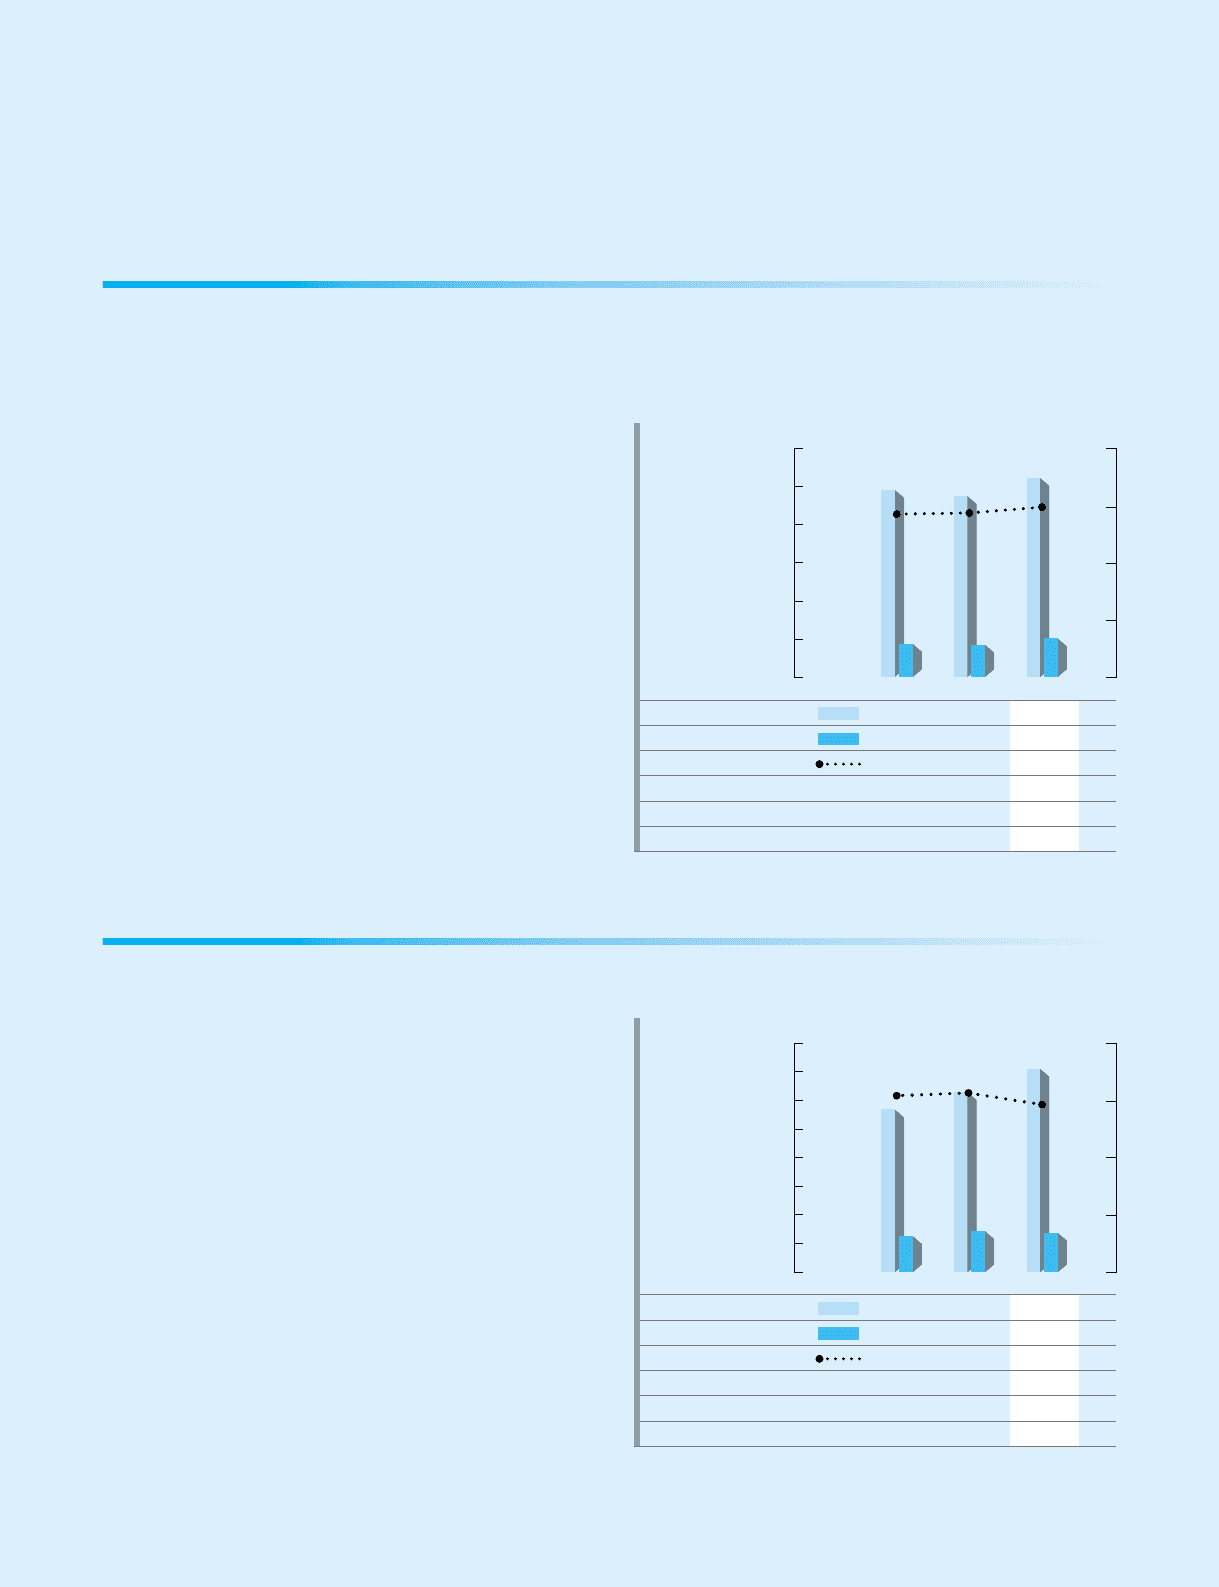
Net sales for the Health Care division grew 13.0% to ¥35,484 million. In contact
lenses, net sales expanded strongly due to efforts by directly managed Eye City
stores to open new locations and increase the ability to attract customers, along
with promotion of consulting sales requiring a high level of expertise. In IOLs,
sales rose both in Japan and overseas as a result of sales of high-value-added
products such as soft and yellow lenses, and due to aggressive efforts to
develop the business globally.
Operating income for the Health Care division decreased 3.9% to ¥6,859
million. In the fourth quarter of the consolidated fiscal year under review,
accounting for expenses related to the point system for product sales at Eye
City was changed from time of use to time of conferment, resulting in a full
year’s worth of point system expenses for the consolidated fiscal year under
review being recorded as a lump sum in SGA expenses during the fourth
quarter. As a result of this change in the accounting treatment for the point
system, and aggressive investment of R&D expenses in the IOL field, the
operating income ratio fell in the short term during the fourth quarter, and the
operating income ratio for the year was down 3.4 percentage points to 19.3%.
By quarter, the operating margin was 24.1% in the first quarter, 24.8% in the
second quarter, 21.0% in the third quarter and 7.6% in the fourth quarter.
On the segment graph, as a result of the increase in the net sales growth
rate combined with the fall in profit margin, the circle has shifted upward and to
the left. It also represents the effect of forward-looking investments made with
an eye to future growth.
Capital investment in the Health Care division increased approximately 3.2
times to ¥2,391 million. This was mainly for capital expenditures related to R&D
in the field of IOLs, and shifting of production plants overseas.
(%)
40
20
0
(Millions of yen)
120,000
100,000
80,000
60,000
40,000
20,000
0
Net sales (Millions of yen)
Operating income (Millions of yen)
Operating income ratio* (%)
Assets (Millions of yen)
Depreciation (Millions of yen)
Capital expenditures (Millions of yen)
98,203
17,496
17.8
92,082
5,735
6,916
94,971
17,079
18.0
90,765
5,900
6,787
104,457
20,370
19.5
98,243
6,444
7,958
(%)
40
20
0
(Millions of yen)
40,000
35,000
30,000
25,000
20,000
15,000
10,000
5,000
0
Net sales (Millions of yen)
Operating income (Millions of yen)
Operating income ratio* (%)
Assets (Millions of yen)
Depreciation (Millions of yen)
Capital expenditures (Millions of yen)
28,381
6,273
22.1
18,873
532
1,201
31,409
7,141
22.7
18,330
669
738
35,484
6,859
19.3
19,927
855
2,391
* The operating income ratio above is calculated using net sales plus intersegment
sales. Please refer to details on page 62 Segment Information.
* The operating income ratio above is calculated using net sales plus intersegment
sales. Please refer to details on page 62 Segment Information.
Eye Care (Vision Care Division)
Eye Care (Health Care Division)
2004 2005 2006
2004 2005 2006