Pentax 2006 Annual Report Download - page 66
Download and view the complete annual report
Please find page 66 of the 2006 Pentax annual report below. You can navigate through the pages in the report by either clicking on the pages listed below, or by using the keyword search tool below to find specific information within the annual report.-
 1
1 -
2
-
3
-
4
-
5
-
6
-
7
-
8
-
9
-
10
-
11
-
12
-
13
-
14
-
15
-
16
-
17
-
18
-
19
-
20
-
21
-
22
-
23
-
24
-
25
-
26
-
27
-
28
-
29
-
30
-
31
-
32
-
33
-
34
-
35
-
36
-
37
-
38
-
39
-
40
-
41
-
42
-
43
-
44
-
45
-
46
-
47
-
48
-
49
-
50
-
51
-
52
-
53
-
54
-
55
-
 56
56 -
 57
57 -
 58
58 -
 59
59 -
 60
60 -
 61
61 -
 62
62 -
 63
63 -
 64
64 -
 65
65 -
 66
66 -
 67
67 -
 68
68 -
 69
69 -
 70
70 -
 71
71 -
 72
72 -
 73
73 -
 74
74 -
 75
75 -
 76
76 -
77
 |
 |

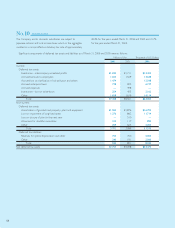
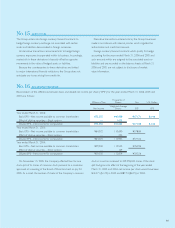
a. Sales and Operating Income
Thousands of U.S. Dollars
2006
Information Lifestyle
Technology Eye Care Refinement
Vision Health Eliminations
Electro-Optics Photonics Care Care Crystal Service Total and Corporate Consolidated
Sales to customers $1,622,133 $85,920 $889,223 $302,068 $15,868 $15,136 $2,930,348 $ — $2,930,348
Intersegment sales 6,333 2,094 9 0 281 36,886 45,603 (45,603) —
Total sales 1,628,466 88,014 889,232 302,068 16,149 52,022 2,975,951 (45,603) 2,930,348
Operating expenses 991,181 80,063 715,825 243,679 17,468 46,514 2,094,730 (24,993) 2,069,737
Operating income (loss) $ 637,285 $ 7,951 $173,407 $ 58,389 $ (1,319) $ 5,508 $ 881,221 $(20,610) $ 860,611
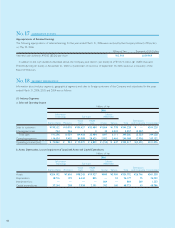
b. Assets, Depreciation, Loss on Impairment of Long-Lived Assets and Capital Expenditures
Thousands of U.S. Dollars
2006
Information Lifestyle
Technology Eye Care Refinement
Vision Health Eliminations
Electro-Optics Photonics Care Care Crystal Service Total and Corporate Consolidated
Assets $1,738,248 $64,748 $836,324 $169,635 $7,151 $33,915 $2,850,021 $227,684 $3,077,705
Depreciation 159,326 928 54,857 7,278 — 451 222,840 638 223,478
Impairment loss —— ——7,355 — 7,355 3,141 10,496
Capital expenditures 317,051 1,771 67,745 20,354 6,487 1,362 414,770 536 415,306
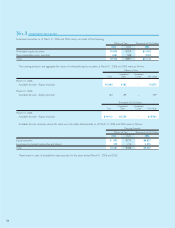
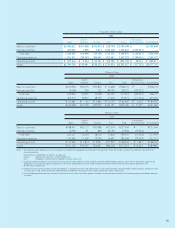
a. Sales and Operating Income
Millions of Yen
2005
Information Lifestyle
Technology Eye Care Refinement
Vision Health Eliminations
Electro-Optics Photonics Care Care Crystal Service Total and Corporate Consolidated
Sales to customers ¥165,664 ¥10,749 ¥94,971 ¥31,409 ¥3,672 ¥1,707 ¥308,172 ¥ — ¥308,172
Intersegment sales 526 234 18 — 50 5,054 5,882 (5,882) —
Total sales 166,190 10,983 94,989 31,409 3,722 6,761 314,054 (5,882) 308,172
Operating expenses 102,900 10,090 77,910 24,268 4,143 6,088 225,399 (2,147) 223,252
Operating income (loss) ¥ 63,290 ¥ 893 ¥17,079 ¥ 7,141 ¥ (421) ¥ 673 ¥ 88,655 ¥(3,735) ¥ 84,920
b. Assets, Depreciation and Capital Expenditures
Millions of Yen
2005
Information Lifestyle
Technology Eye Care Refinement
Vision Health Eliminations
Electro-Optics Photonics Care Care Crystal Service Total and Corporate Consolidated
Assets ¥162,638 ¥7,648 ¥90,765 ¥18,330 ¥1,900 ¥3,216 ¥284,497 ¥66,985 ¥351,482
Depreciation 14,730 126 5,900 669 — 82 21,507 154 21,661
Impairment loss — 767 — — 92 — 859 — 859
Capital expenditures 31,962 191 6,787 738 92 219 39,989 186 40,175