Pentax 2006 Annual Report Download - page 67
Download and view the complete annual report
Please find page 67 of the 2006 Pentax annual report below. You can navigate through the pages in the report by either clicking on the pages listed below, or by using the keyword search tool below to find specific information within the annual report.-
 1
1 -
2
-
3
-
4
-
5
-
6
-
7
-
8
-
9
-
10
-
11
-
12
-
13
-
14
-
15
-
16
-
17
-
18
-
19
-
20
-
21
-
22
-
23
-
24
-
25
-
26
-
27
-
28
-
29
-
30
-
31
-
32
-
33
-
34
-
35
-
36
-
37
-
38
-
39
-
40
-
41
-
42
-
43
-
44
-
45
-
46
-
47
-
48
-
49
-
50
-
51
-
52
-
53
-
54
-
55
-
56
-
 57
57 -
 58
58 -
 59
59 -
 60
60 -
 61
61 -
 62
62 -
 63
63 -
 64
64 -
 65
65 -
 66
66 -
 67
67 -
 68
68 -
 69
69 -
 70
70 -
 71
71 -
 72
72 -
 73
73 -
 74
74 -
 75
75 -
 76
76 -
 77
77
 |
 |
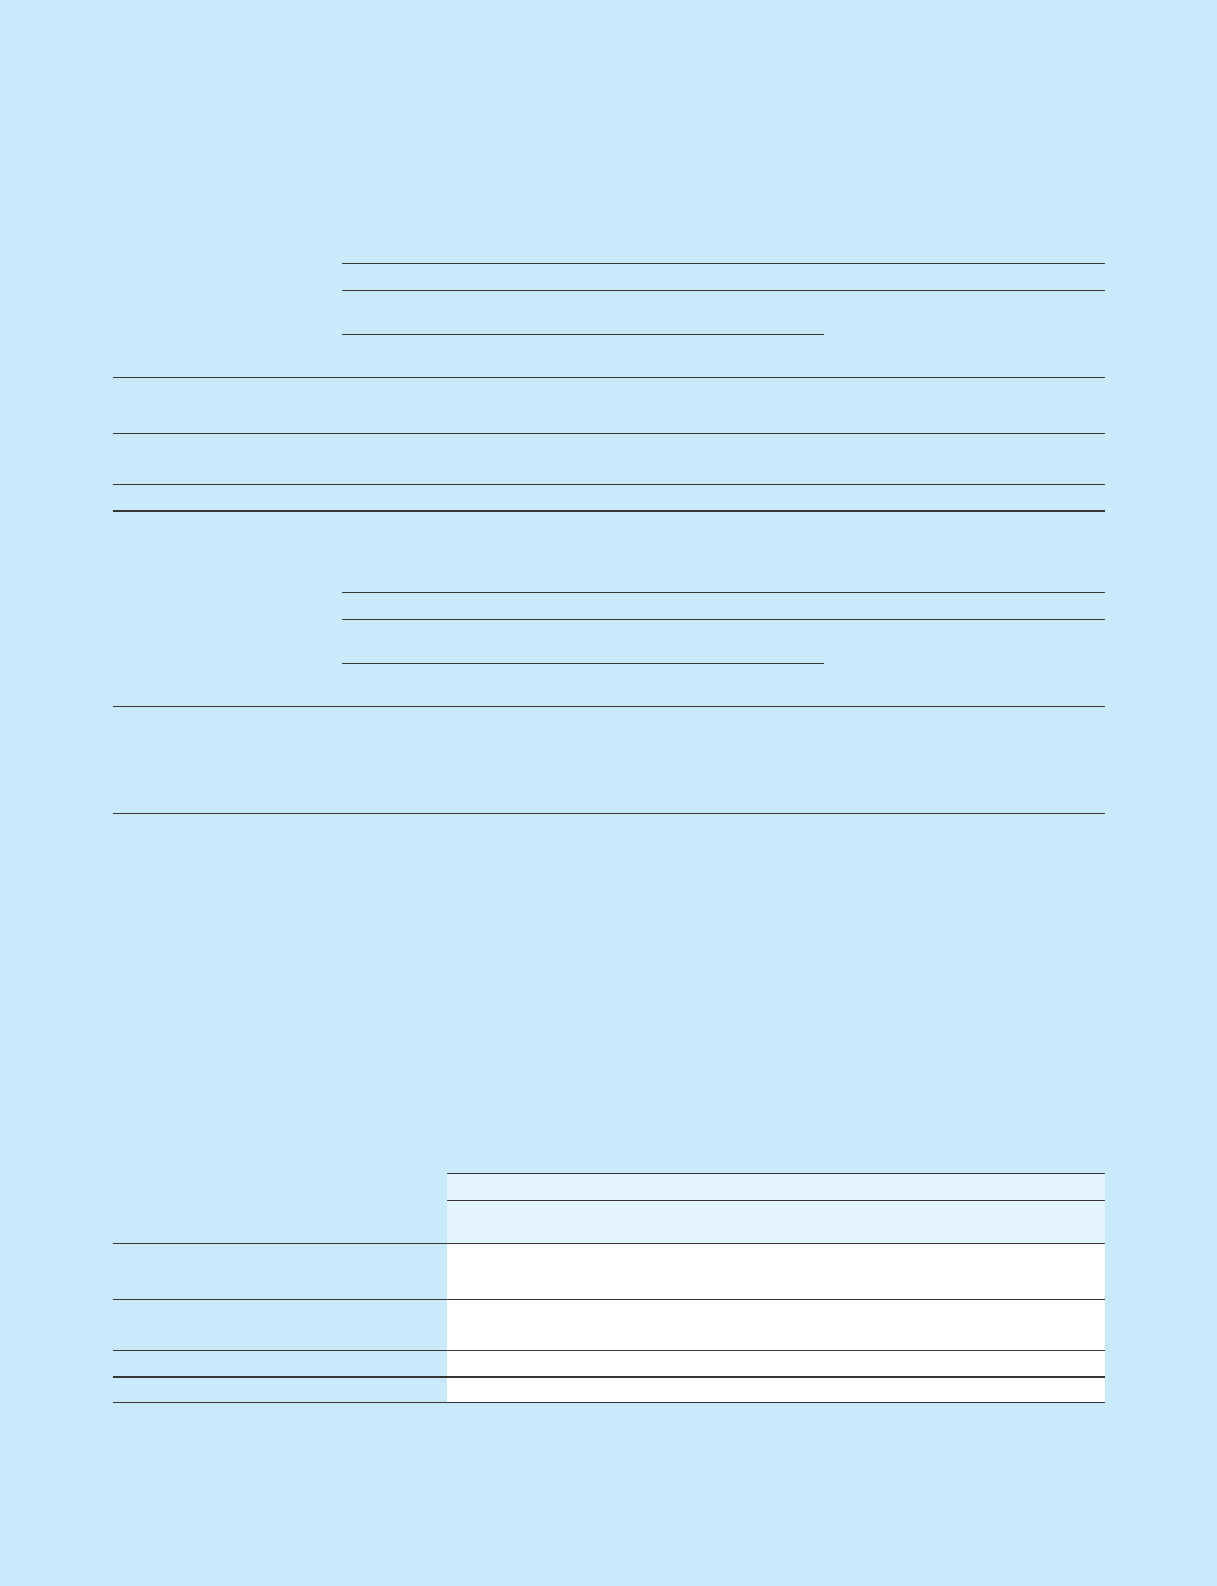
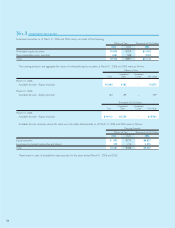
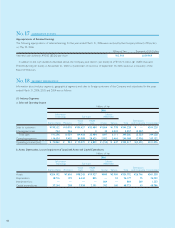
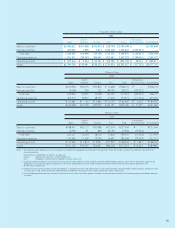
a. Sales and Operating Income
Millions of Yen
2004
Information Lifestyle
Technology Eye Care Refinement
Vision Health Eliminations
Electro-Optics Photonics Care Care Crystal Service Total and Corporate Consolidated
Sales to customers ¥135,071 ¥4,116 ¥98,203 ¥28,381 ¥4,322 ¥1,351 ¥271,444 ¥ — ¥271,444
Intersegment sales 81 — 18 — 62 5,804 5,965 (5,965) —
Total sales 135,152 4,116 98,221 28,381 4,384 7,155 277,409 (5,965) 271,444
Operating expenses 89,982 4,193 80,725 22,108 4,880 6,547 208,435 (5,158) 203,277
Operating income (loss) ¥ 45,170 ¥ (77) ¥17,496 ¥ 6,273 ¥ (496) ¥ 608 ¥ 68,974 ¥ (807) ¥ 68,167
b. Assets, Depreciation and Capital Expenditures
Millions of Yen
2004
Information Lifestyle
Technology Eye Care Refinement
Vision Health Eliminations
Electro-Optics Photonics Care Care Crystal Service Total and Corporate Consolidated
Assets ¥132,240 ¥1,748 ¥92,082 ¥18,873 ¥2,805 ¥2,797 ¥250,545 ¥39,342 ¥289,887
Depreciation 13,205 59 5,735 532 352 30 19,913 75 19,988
Impairment loss — — — — 2,040 — 2,040 — 2,040
Capital expenditures 22,247 36 6,916 1,201 224 14 30,638 21 30,659
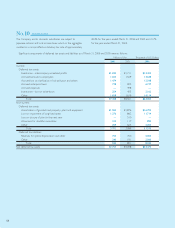
Notes: 1. The Company and subsidiaries primarily engage in the manufacture and sale of products in six major segments grouped on the basis of similarities in the types, nature and
market of the products. The six segments, namely, Electro-Optics, Photonics, Vision Care, Health Care, Crystal and Service, consist primarily of the following products:
Electro-Optics: Photomasks and mask blanks for semiconductors, masks for liquid-crystal display (LCD), parts for glass panels of LCDs, glass disks for hard disk drives
(HDDs), optical lenses, optical glasses, electronic glasses, optical communication products, etc.
Photonics: Laser equipment, light sources for use in the electronics industry, special optical glass, etc.
Vision Care: Eyeglasses, eyeglass frames, etc.
Health Care: Contact lenses and related accessories, intraocular lenses, etc.
Crystal: Crystal glass products
Service: Construction of information systems, outsourcing, etc.
2. Corporate operating expenses consist primarily of the administration expenses of the Company and foreign holding companies, which are not allocated to industry segments.
Corporate operating expenses for the years ended March 31, 2006, 2005 and 2004 were ¥2,630 million ($22,389 thousand), ¥2,873 million and ¥2,424 million, respectively.
3. Corporate assets consist primarily of cash, time deposits, investment securities and administrative assets of the Company and the foreign holding companies. Corporate
assets as of March 31, 2006, 2005 and 2004 were ¥35,135 million ($299,098 thousand), ¥75,076 million and ¥52,594 million, respectively.
4. Consolidated operating expenses are equal to the total of cost of sales and selling, general and administrative expenses shown in the accompanying consolidated statements
of income.
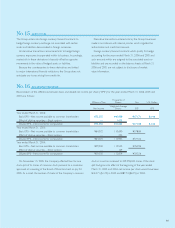
(2) Geographical Segments
The geographical segments of the Company and subsidiaries for the years ended March 31, 2006, 2005 and 2004 are summarized as follows:
Millions of Yen
2006
North Eliminations
Japan America Europe Asia Total and Corporate Consolidated
Sales to customers ¥244,998 ¥35,471 ¥39,232 ¥ 24,527 ¥344,228 ¥ — ¥344,228
Interarea transfers 23,901 222 683 120,813 145,619 (145,619) —
Total sales 268,899 35,693 39,915 145,340 489,847 (145,619) 344,228
Operating expenses 230,414 34,606 33,367 97,226 395,613 (152,481) 243,132
Operating income ¥ 38,485 ¥ 1,087 ¥ 6,548 ¥ 48,114 ¥ 94,234 ¥ 6,862 ¥101,096
Assets ¥163,840 ¥22,377 ¥63,346 ¥149,299 ¥398,862 ¥ (37,324) ¥361,538