Oracle 2011 Annual Report Download - page 75
Download and view the complete annual report
Please find page 75 of the 2011 Oracle annual report below. You can navigate through the pages in the report by either clicking on the pages listed below, or by using the keyword search tool below to find specific information within the annual report.-
 1
1 -
2
-
3
-
4
-
5
-
6
-
7
-
8
-
9
-
10
-
11
-
12
-
13
-
14
-
15
-
16
-
17
-
18
-
19
-
20
-
21
-
22
-
23
-
24
-
25
-
26
-
27
-
28
-
29
-
30
-
31
-
32
-
33
-
34
-
35
-
36
-
37
-
38
-
39
-
40
-
41
-
42
-
43
-
44
-
45
-
46
-
47
-
48
-
49
-
50
-
51
-
52
-
53
-
54
-
55
-
56
-
57
-
58
-
59
-
60
-
61
-
62
-
63
-
64
-
 65
65 -
 66
66 -
 67
67 -
 68
68 -
 69
69 -
 70
70 -
 71
71 -
 72
72 -
 73
73 -
 74
74 -
 75
75 -
 76
76 -
 77
77 -
 78
78 -
 79
79 -
 80
80 -
 81
81 -
 82
82 -
 83
83 -
 84
84 -
 85
85 -
86
-
87
-
88
-
89
-
90
-
91
-
92
-
93
-
94
-
95
-
96
-
97
-
98
-
99
-
100
-
101
-
102
-
103
-
104
-
105
-
106
-
107
-
108
-
109
-
110
-
111
-
112
-
113
-
114
-
115
-
116
-
117
-
118
-
119
-
120
-
121
-
122
-
123
-
124
-
125
-
126
-
127
-
128
-
129
-
130
-
131
-
132
-
133
-
134
-
135
-
136
-
137
-
138
-
139
-
140
 |
 |

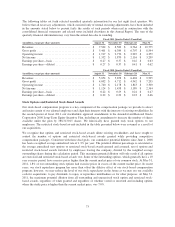
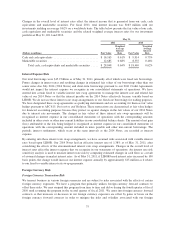
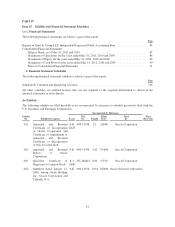
The following tables set forth selected unaudited quarterly information for our last eight fiscal quarters. We
believe that all necessary adjustments, which consisted only of normal recurring adjustments, have been included
in the amounts stated below to present fairly the results of such periods when read in conjunction with the
consolidated financial statements and related notes included elsewhere in this Annual Report. The sum of the
quarterly financial information may vary from the annual data due to rounding.
Fiscal 2011 Quarter Ended (Unaudited)
(in millions, except per share amounts) August 31 November 30 February 28 May 31
Revenues ....................................... $ 7,502 $ 8,582 $ 8,764 $ 10,775
Gross profit ..................................... $ 5,401 $ 6,384 $ 6,707 $ 8,544
Operating income ................................ $ 1,917 $ 2,770 $ 2,987 $ 4,359
Net income ..................................... $ 1,352 $ 1,870 $ 2,116 $ 3,209
Earnings per share—basic .......................... $ 0.27 $ 0.37 $ 0.42 $ 0.63
Earnings per share—diluted ........................ $ 0.27 $ 0.37 $ 0.41 $ 0.62
Fiscal 2010 Quarter Ended (Unaudited)
(in millions, except per share amounts) August 31 November 30 February 28 May 31
Revenues ....................................... $ 5,054 $ 5,858 $ 6,404 $ 9,505
Gross profit ..................................... $ 4,002 $ 4,712 $ 4,942 $ 7,205
Operating income ................................ $ 1,740 $ 2,178 $ 1,843 $ 3,300
Net income ..................................... $ 1,124 $ 1,458 $ 1,189 $ 2,364
Earnings per share—basic .......................... $ 0.22 $ 0.29 $ 0.24 $ 0.47
Earnings per share—diluted ........................ $ 0.22 $ 0.29 $ 0.23 $ 0.46
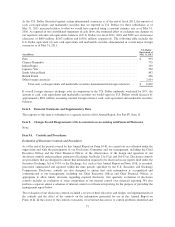
Stock Options and Restricted Stock-Based Awards
Our stock-based compensation program is a key component of the compensation package we provide to attract
and retain certain of our talented employees and align their interests with the interests of existing stockholders. In
the second quarter of fiscal 2011, our stockholders approved amendments to the Amended and Restated Oracle
Corporation 2000 Long-Term Equity Incentive Plan, including an amendment to increase the number of shares
available under the plan by 388,313,015 shares. We historically have granted only stock options to our
employees. The restricted stock-based awards included in the table presented below were assumed as a result of
our acquisitions.
We recognize that options and restricted stock-based awards dilute existing stockholders and have sought to
control the number of options and restricted stock-based awards granted while providing competitive
compensation packages. Consistent with these dual goals, our cumulative potential dilution since June 1, 2008
has been a weighted average annualized rate of 1.3% per year. The potential dilution percentage is calculated as
the average annualized new options or restricted stock-based awards granted and assumed, net of options and
restricted stock-based awards forfeited by employees leaving the company, divided by the weighted average
outstanding shares during the calculation period. This maximum potential dilution will only result if all options
are exercised and restricted stock-based awards vest. Some of the outstanding options, which generally have a 10
year exercise period, have exercise prices higher than the current market price of our common stock. At May 31,
2011, 1.8% of our outstanding stock options had exercise prices in excess of the current market price. In recent
years, our stock repurchase program has more than offset the dilutive effect of our stock-based compensation
program; however, we may reduce the level of our stock repurchases in the future as we may use our available
cash for acquisitions, to pay dividends, to repay or repurchase indebtedness or for other purposes. At May 31,
2011, the maximum potential dilution from all outstanding and unexercised stock option and restricted stock-
based awards, regardless of when granted and regardless of whether vested or unvested and including options
where the strike price is higher than the current market price, was 7.0%.
73