Oracle 2011 Annual Report Download - page 131
Download and view the complete annual report
Please find page 131 of the 2011 Oracle annual report below. You can navigate through the pages in the report by either clicking on the pages listed below, or by using the keyword search tool below to find specific information within the annual report.-
 1
1 -
2
-
3
-
4
-
5
-
6
-
7
-
8
-
9
-
10
-
11
-
12
-
13
-
14
-
15
-
16
-
17
-
18
-
19
-
20
-
21
-
22
-
23
-
24
-
25
-
26
-
27
-
28
-
29
-
30
-
31
-
32
-
33
-
34
-
35
-
36
-
37
-
38
-
39
-
40
-
41
-
42
-
43
-
44
-
45
-
46
-
47
-
48
-
49
-
50
-
51
-
52
-
53
-
54
-
55
-
56
-
57
-
58
-
59
-
60
-
61
-
62
-
63
-
64
-
65
-
66
-
67
-
68
-
69
-
70
-
71
-
72
-
73
-
74
-
75
-
76
-
77
-
78
-
79
-
80
-
81
-
82
-
83
-
84
-
85
-
86
-
87
-
88
-
89
-
90
-
91
-
92
-
93
-
94
-
95
-
96
-
97
-
98
-
99
-
100
-
101
-
102
-
103
-
104
-
105
-
106
-
107
-
108
-
109
-
110
-
111
-
112
-
113
-
114
-
115
-
116
-
117
-
118
-
119
-
120
-
 121
121 -
 122
122 -
 123
123 -
 124
124 -
 125
125 -
 126
126 -
 127
127 -
 128
128 -
 129
129 -
 130
130 -
 131
131 -
 132
132 -
 133
133 -
 134
134 -
 135
135 -
 136
136 -
 137
137 -
 138
138 -
 139
139 -
 140
140
 |
 |

ORACLE CORPORATION
NOTES TO CONSOLIDATED FINANCIAL STATEMENTS—(Continued)
May 31, 2011
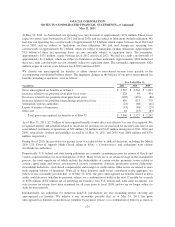
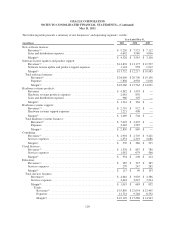
(1) Operating segment revenues generally differ from the external reporting classifications due to certain software license products that are
classified as service revenues for management reporting purposes. Software license updates and product support revenues for
management reporting included $80 million, $86 million and $243 million of revenues that we did not recognize in the accompanying
consolidated statements of operations in fiscal 2011, 2010 and 2009, respectively. In addition, we did not recognize hardware systems
support revenues related to hardware systems support contracts that would have otherwise been recorded by Sun as an independent
entity, in the amount of $148 million and $128 million in fiscal 2011 and 2010, respectively. See Note 10 for an explanation of these
adjustments and the following table for a reconciliation of operating segment revenues to total revenues.
(2) The margins reported reflect only the direct controllable costs of each line of business and do not include allocations of product
development, information technology, marketing and partner programs, and corporate and general and administrative expenses.
Additionally, the margins do not reflect inventory fair value adjustments, amortization of intangible assets, acquisition related and other
expenses, restructuring costs, or stock-based compensation.
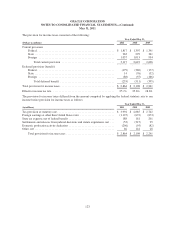
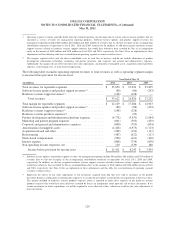
The following table reconciles operating segment revenues to total revenues as well as operating segment margin
to income before provision for income taxes:
Year Ended May 31,
(in millions) 2011 2010 2009
Total revenues for reportable segments ......................... $ 35,850 $ 27,034 $ 23,495
Software license updates and product support revenues(1) .......... (80) (86) (243)
Hardware systems support revenues(1) .......................... (148) (128) —
Total revenues ........................................ $ 35,622 $ 26,820 $ 23,252
Total margin for reportable segments .......................... $ 22,129 $ 17,286 $ 14,943
Software license updates and product support revenues(1) .......... (80) (86) (243)
Hardware systems support revenues(1) .......................... (148) (128) —
Hardware systems products expenses(2) ......................... — (29) —
Product development and information technology expenses ........ (4,778) (3,479) (2,984)
Marketing and partner program expenses ....................... (601) (503) (439)
Corporate and general and administrative expenses ............... (800) (755) (634)
Amortization of intangible assets ............................. (2,428) (1,973) (1,713)
Acquisition related and other ................................. (208) (154) (117)
Restructuring ............................................. (487) (622) (117)
Stock-based compensation .................................. (500) (421) (340)
Interest expense ........................................... (808) (754) (630)
Non-operating income (expense), net .......................... 120 (139) 108
Income before provision for income taxes .................. $ 11,411 $ 8,243 $ 7,834
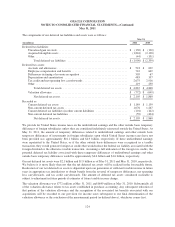
(1) Software license updates and product support revenues for management reporting include $80 million, $86 million and $243 million of
revenues that we did not recognize in the accompanying consolidated statements of operations for fiscal 2011, 2010 and 2009,
respectively. In addition, we did not recognize hardware systems support revenues related to hardware systems support contracts that
would have otherwise been recorded by Sun as an independent entity, in the amounts of $148 million and $128 million for fiscal 2011
and 2010, respectively. See Note 10 for an explanation of these adjustments and this table for a reconciliation of operating segment
revenues to total revenues.
(2) Represents the effects of fair value adjustments to our inventories acquired from Sun that were sold to customers in the periods
presented. Business combination accounting rules require us to account for inventories assumed from our acquisitions at their fair values.
The amount included in hardware systems products expenses above is intended to adjust these expenses to the hardware systems
products expenses that would have been otherwise recorded by Sun as an independent entity upon the sale of these inventories. If we
assume inventories in future acquisitions, we will be required to assess their fair values, which may result in fair value adjustments to
those inventories.
129