Oracle 2011 Annual Report Download - page 54
Download and view the complete annual report
Please find page 54 of the 2011 Oracle annual report below. You can navigate through the pages in the report by either clicking on the pages listed below, or by using the keyword search tool below to find specific information within the annual report.-
 1
1 -
2
-
3
-
4
-
5
-
6
-
7
-
8
-
9
-
10
-
11
-
12
-
13
-
14
-
15
-
16
-
17
-
18
-
19
-
20
-
21
-
22
-
23
-
24
-
25
-
26
-
27
-
28
-
29
-
30
-
31
-
32
-
33
-
34
-
35
-
36
-
37
-
38
-
39
-
40
-
41
-
42
-
43
-
 44
44 -
 45
45 -
 46
46 -
 47
47 -
 48
48 -
 49
49 -
 50
50 -
 51
51 -
 52
52 -
 53
53 -
 54
54 -
 55
55 -
 56
56 -
 57
57 -
 58
58 -
 59
59 -
 60
60 -
 61
61 -
 62
62 -
 63
63 -
 64
64 -
65
-
66
-
67
-
68
-
69
-
70
-
71
-
72
-
73
-
74
-
75
-
76
-
77
-
78
-
79
-
80
-
81
-
82
-
83
-
84
-
85
-
86
-
87
-
88
-
89
-
90
-
91
-
92
-
93
-
94
-
95
-
96
-
97
-
98
-
99
-
100
-
101
-
102
-
103
-
104
-
105
-
106
-
107
-
108
-
109
-
110
-
111
-
112
-
113
-
114
-
115
-
116
-
117
-
118
-
119
-
120
-
121
-
122
-
123
-
124
-
125
-
126
-
127
-
128
-
129
-
130
-
131
-
132
-
133
-
134
-
135
-
136
-
137
-
138
-
139
-
140
 |
 |

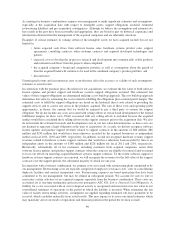
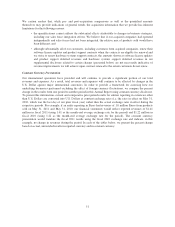
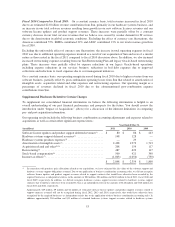
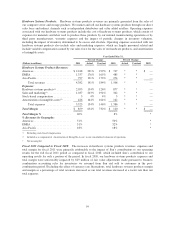
Total Revenues and Operating Expenses
Year Ended May 31,
Percent Change Percent Change
(Dollars in millions) 2011 Actual Constant 2010 Actual Constant 2009
Total Revenues by Geography:
Americas .................... $18,352 33% 32% $ 13,819 16% 15% $ 11,900
EMEA(1) ..................... 11,497 29% 28% 8,938 12% 13% 7,948
Asia Pacific(2) ................ 5,773 42% 32% 4,063 19% 12% 3,404
Total revenues ............ 35,622 33% 30% 26,820 15% 14% 23,252
Total Operating Expenses ...... 23,589 33% 31% 17,758 19% 18% 14,931
Total Operating Margin ........ $12,033 33% 29% $ 9,062 9% 6% $ 8,321
Total Operating Margin % ...... 34% 34% 36%
% Revenues by Geography:
Americas .................... 52% 52% 51%
EMEA ...................... 32% 33% 34%
Asia Pacific .................. 16% 15% 15%
Total Revenues by Business:
Software .................... $24,031 17% 15% $ 20,625 9% 8% $ 18,877
Hardware Systems ............. 6,944 203% 195% 2,290 * * —
Services ..................... 4,647 19% 17% 3,905 -11% -12% 4,375
Total revenues ............ $35,622 33% 30% $ 26,820 15% 14% $ 23,252
% Revenues by Business:
Software .................... 68% 77% 81%
Hardware Systems ............. 19% 9% 0%
Services ..................... 13% 14% 19%
(1) Comprised of Europe, the Middle East and Africa
(2) Asia Pacific includes Japan
* Not meaningful
Fiscal 2011 Compared to Fiscal 2010: Our total revenues increased in fiscal 2011 due to $4.7 billion of
incremental revenue contribution from our hardware systems business and significant increases in our software
and services businesses’ revenues. Our total revenues growth across all of our businesses in fiscal 2011 was
favorably affected by a full year of revenue contributions from Sun as compared to our fiscal 2010 operating
results, for which Sun’s revenue contributions were limited to only a portion of the fiscal 2010 period. In
addition, our software business revenues increased as a result of the growth in our new software license revenues
and our software license updates and product support revenues. Excluding the effect of currency rate fluctuations,
the Americas contributed 55%, EMEA contributed 29% and APAC contributed 16% to our total revenues
growth.
Excluding the effect of foreign currency rate fluctuations, the increase in total operating expenses in fiscal 2011
was due to a full year of expense contributions from Sun to our fiscal 2011 operating results, including increased
expenses pertaining to hardware systems products sold and related hardware systems support offerings,
additional employee related expenses, and an increase in intangible asset amortization. These increases were
partially offset by a reduction in restructuring expenses relating to our Sun Restructuring Plan and certain other
Oracle-based restructuring plans, and were also favorably affected by a $120 million benefit related to the
recovery of legal costs, and certain other insurance recoveries in fiscal 2011.
On a constant currency basis, our operating margin increased during fiscal 2011 due to our total revenues growth.
Our operating margin as a percentage of revenues remained flat in fiscal 2011 as our revenues and expenses grew
at approximately the same rates.
52