Oracle 2011 Annual Report Download - page 103
Download and view the complete annual report
Please find page 103 of the 2011 Oracle annual report below. You can navigate through the pages in the report by either clicking on the pages listed below, or by using the keyword search tool below to find specific information within the annual report.-
 1
1 -
2
-
3
-
4
-
5
-
6
-
7
-
8
-
9
-
10
-
11
-
12
-
13
-
14
-
15
-
16
-
17
-
18
-
19
-
20
-
21
-
22
-
23
-
24
-
25
-
26
-
27
-
28
-
29
-
30
-
31
-
32
-
33
-
34
-
35
-
36
-
37
-
38
-
39
-
40
-
41
-
42
-
43
-
44
-
45
-
46
-
47
-
48
-
49
-
50
-
51
-
52
-
53
-
54
-
55
-
56
-
57
-
58
-
59
-
60
-
61
-
62
-
63
-
64
-
65
-
66
-
67
-
68
-
69
-
70
-
71
-
72
-
73
-
74
-
75
-
76
-
77
-
78
-
79
-
80
-
81
-
82
-
83
-
84
-
85
-
86
-
87
-
88
-
89
-
90
-
91
-
92
-
 93
93 -
 94
94 -
 95
95 -
 96
96 -
 97
97 -
 98
98 -
 99
99 -
 100
100 -
 101
101 -
 102
102 -
 103
103 -
 104
104 -
 105
105 -
 106
106 -
 107
107 -
 108
108 -
 109
109 -
 110
110 -
 111
111 -
 112
112 -
 113
113 -
114
-
115
-
116
-
117
-
118
-
119
-
120
-
121
-
122
-
123
-
124
-
125
-
126
-
127
-
128
-
129
-
130
-
131
-
132
-
133
-
134
-
135
-
136
-
137
-
138
-
139
-
140
 |
 |

ORACLE CORPORATION
NOTES TO CONSOLIDATED FINANCIAL STATEMENTS—(Continued)
May 31, 2011
Advertising
All advertising costs are expensed as incurred. Advertising expenses, which are included within sales and
marketing expenses, were $88 million, $75 million and $71 million in fiscal 2011, 2010 and 2009, respectively.
Research and Development
All research and development costs are expensed as incurred. Costs eligible for capitalization under ASC 985-20,
Software-Costs of Software to be Sold, Leased or Marketed, were not material to our consolidated financial
statements in fiscal 2011, 2010 or 2009.
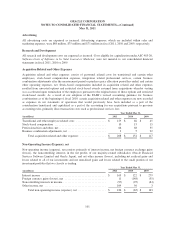
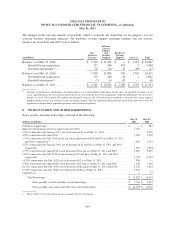
Acquisition Related and Other Expenses
Acquisition related and other expenses consist of personnel related costs for transitional and certain other
employees, stock-based compensation expenses, integration related professional services, certain business
combination adjustments after the measurement period or purchase price allocation period has ended, and certain
other operating expenses, net. Stock-based compensation included in acquisition related and other expenses
resulted from unvested options and restricted stock-based awards assumed from acquisitions whereby vesting
was accelerated upon termination of the employees pursuant to the original terms of those options and restricted
stock-based awards. As a result of our adoption of the FASB’s revised accounting guidance for business
combinations as of the beginning of fiscal 2010, certain acquisition related and other expenses are now recorded
as expenses in our statements of operations that would previously have been included as a part of the
consideration transferred and capitalized as a part of the accounting for our acquisitions pursuant to previous
accounting rules, primarily direct transaction costs such as professional services fees.
Year Ended May 31,
(in millions) 2011 2010 2009
Transitional and other employee related costs ..................... $ 129 $ 66 $ 45
Stock-based compensation .................................... 10 15 15
Professional fees and other, net ................................. 66 68 35
Business combination adjustments, net ........................... 3 5 22
Total acquisition related and other expenses .................. $ 208 $ 154 $ 117
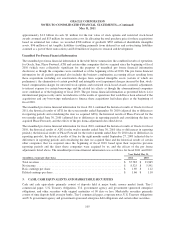
Non-Operating Income (Expense), net
Non-operating income (expense), net consists primarily of interest income, net foreign currency exchange gains
(losses), the noncontrolling interests in the net profits of our majority-owned subsidiaries (Oracle Financial
Services Software Limited and Oracle Japan), and net other income (losses), including net realized gains and
losses related to all of our investments and net unrealized gains and losses related to the small portion of our
investment portfolio that we classify as trading.
Year Ended May 31,
(in millions) 2011 2010 2009
Interest income ............................................. $ 163 $ 122 $ 279
Foreign currency gains (losses), net ............................. 11 (148) (55)
Noncontrolling interests in income .............................. (97) (95) (84)
Other income, net ........................................... 109 56 3
Total non-operating income (expense), net .................... $ 186 $ (65) $ 143
101