Oracle 2011 Annual Report Download - page 55
Download and view the complete annual report
Please find page 55 of the 2011 Oracle annual report below. You can navigate through the pages in the report by either clicking on the pages listed below, or by using the keyword search tool below to find specific information within the annual report.-
 1
1 -
2
-
3
-
4
-
5
-
6
-
7
-
8
-
9
-
10
-
11
-
12
-
13
-
14
-
15
-
16
-
17
-
18
-
19
-
20
-
21
-
22
-
23
-
24
-
25
-
26
-
27
-
28
-
29
-
30
-
31
-
32
-
33
-
34
-
35
-
36
-
37
-
38
-
39
-
40
-
41
-
42
-
43
-
44
-
 45
45 -
 46
46 -
 47
47 -
 48
48 -
 49
49 -
 50
50 -
 51
51 -
 52
52 -
 53
53 -
 54
54 -
 55
55 -
 56
56 -
 57
57 -
 58
58 -
 59
59 -
 60
60 -
 61
61 -
 62
62 -
 63
63 -
 64
64 -
 65
65 -
66
-
67
-
68
-
69
-
70
-
71
-
72
-
73
-
74
-
75
-
76
-
77
-
78
-
79
-
80
-
81
-
82
-
83
-
84
-
85
-
86
-
87
-
88
-
89
-
90
-
91
-
92
-
93
-
94
-
95
-
96
-
97
-
98
-
99
-
100
-
101
-
102
-
103
-
104
-
105
-
106
-
107
-
108
-
109
-
110
-
111
-
112
-
113
-
114
-
115
-
116
-
117
-
118
-
119
-
120
-
121
-
122
-
123
-
124
-
125
-
126
-
127
-
128
-
129
-
130
-
131
-
132
-
133
-
134
-
135
-
136
-
137
-
138
-
139
-
140
 |
 |

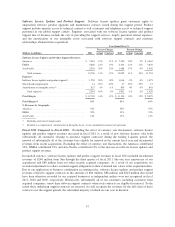
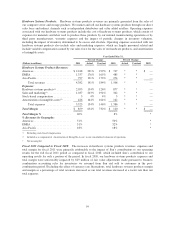
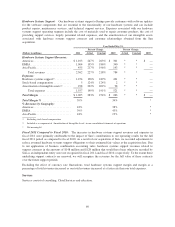
Fiscal 2010 Compared to Fiscal 2009: On a constant currency basis, total revenues increased in fiscal 2010
due to an estimated $2.8 billion revenue contribution from Sun, primarily in our hardware systems business, and
an increase in our total software revenues resulting from growth in our new software licenses revenues and our
software license updates and product support revenues. These increases were partially offset by a constant
currency decrease in our total services revenues that we believe was caused by weaker demand for IT services
due to the deterioration in global economic conditions. Excluding the effect of currency rate fluctuations, the
Americas contributed 55%, EMEA contributed 32% and APAC contributed 13% to our total revenues growth in
fiscal 2010.
Excluding the unfavorable effect of currency rate fluctuations, the increase in total operating expenses in fiscal
2010 was due to additional operating expenses incurred as a result of our acquisition of Sun and were of a similar
nature as those noted in the fiscal 2011 compared to fiscal 2010 discussion above. In addition, we also incurred
increased restructuring expenses resulting from our Sun Restructuring Plan and legacy Oracle-based restructuring
plans. These increases were partially offset by expense reductions in our legacy Oracle-based operations
including expense reductions in our services business, reductions in bad debt expenses due to improved
collections and reductions to travel expenses due to cost management initiatives.
On a constant currency basis, our operating margin increased during fiscal 2010 due to higher revenues from our
software business, partially offset by post-combination operating losses from Sun that related to amortization of
intangible assets, acquisition related and other expenses and restructuring expenses. Our operating margin as a
percentage of revenues declined in fiscal 2010 due to the aforementioned post-combination expense
contributions from Sun.
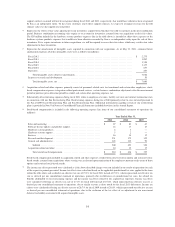
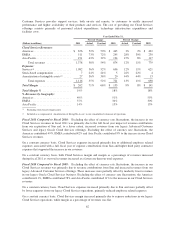
Supplemental Disclosure Related to Certain Charges
To supplement our consolidated financial information we believe the following information is helpful to an
overall understanding of our past financial performance and prospects for the future. You should review the
introduction under “Impact of Acquisitions” (above) for a discussion of the inherent limitations in comparing
pre- and post-acquisition information.
Our operating results include the following business combination accounting adjustments and expenses related to
acquisitions as well as certain other significant expense items:
Year Ended May 31,
(in millions) 2011 2010 2009
Software license updates and product support deferred revenues(1) . . . $ 80 $ 86 $ 243
Hardware systems support deferred revenues(1) .................. 148 128 —
Hardware systems products expenses(2) ......................... — 29 —
Amortization of intangible assets(3) ............................ 2,428 1,973 1,713
Acquisition related and other(4)(6) ............................. 208 154 117
Restructuring(5) ........................................... 487 622 117
Stock-based compensation(6) ................................. 500 421 340
Income tax effects(7) ........................................ (1,003) (1,054) (730)
$ 2,848 $ 2,359 $ 1,800
(1) In connection with purchase price allocations related to our acquisitions, we have estimated the fair values of the software support and
hardware systems support obligations assumed. Due to our application of business combination accounting rules, we did not recognize
software license updates and product support revenues related to support contracts that would have otherwise been recorded by the
acquired businesses as independent entities, in the amounts of $80 million, $86 million and $243 million in fiscal 2011, fiscal 2010 and
fiscal 2009, respectively. In addition, we did not recognize hardware systems support revenues related to hardware systems support
contracts that would have otherwise been recorded by Sun as an independent entity in the amounts of $148 million and $128 million for
fiscal 2011 and 2010, respectively.
Approximately $29 million, $9 million and $2 million of estimated software license updates and product support revenues related to
support contracts assumed will not be recognized during fiscal 2012, 2013 and 2014, respectively, that would have otherwise been
recognized by the acquired businesses as independent entities due to the application of these business combination accounting rules. In
addition, approximately $30 million and $11 million of estimated hardware systems support revenues related to hardware systems
53