Oracle 2011 Annual Report Download - page 101
Download and view the complete annual report
Please find page 101 of the 2011 Oracle annual report below. You can navigate through the pages in the report by either clicking on the pages listed below, or by using the keyword search tool below to find specific information within the annual report.-
 1
1 -
2
-
3
-
4
-
5
-
6
-
7
-
8
-
9
-
10
-
11
-
12
-
13
-
14
-
15
-
16
-
17
-
18
-
19
-
20
-
21
-
22
-
23
-
24
-
25
-
26
-
27
-
28
-
29
-
30
-
31
-
32
-
33
-
34
-
35
-
36
-
37
-
38
-
39
-
40
-
41
-
42
-
43
-
44
-
45
-
46
-
47
-
48
-
49
-
50
-
51
-
52
-
53
-
54
-
55
-
56
-
57
-
58
-
59
-
60
-
61
-
62
-
63
-
64
-
65
-
66
-
67
-
68
-
69
-
70
-
71
-
72
-
73
-
74
-
75
-
76
-
77
-
78
-
79
-
80
-
81
-
82
-
83
-
84
-
85
-
86
-
87
-
88
-
89
-
90
-
 91
91 -
 92
92 -
 93
93 -
 94
94 -
 95
95 -
 96
96 -
 97
97 -
 98
98 -
 99
99 -
 100
100 -
 101
101 -
 102
102 -
 103
103 -
 104
104 -
 105
105 -
 106
106 -
 107
107 -
 108
108 -
 109
109 -
 110
110 -
 111
111 -
112
-
113
-
114
-
115
-
116
-
117
-
118
-
119
-
120
-
121
-
122
-
123
-
124
-
125
-
126
-
127
-
128
-
129
-
130
-
131
-
132
-
133
-
134
-
135
-
136
-
137
-
138
-
139
-
140
 |
 |
ORACLE CORPORATION
NOTES TO CONSOLIDATED FINANCIAL STATEMENTS—(Continued)
May 31, 2011
quantities and obsolescence. This evaluation includes analysis of sales levels by product and projections of future
demand within specific time horizons (generally six months or less). Inventories in excess of future demand are
written down and charged to hardware systems products expenses. In addition, we assess the impact of changing
technology to our inventories and we write down inventories that are considered obsolete. At the point of the loss
recognition, a new, lower-cost basis for that inventory is established, and subsequent changes in facts and
circumstances do not result in the restoration or increase in that newly established cost basis.
Other Receivables
Other receivables represent value-added tax and sales tax receivables associated with the sale of our products and
services to third parties. Other receivables are included in prepaid expenses and other current assets in our
consolidated balance sheets and totaled $876 million and $733 million at May 31, 2011 and 2010, respectively.
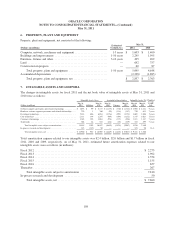
Property, Plant and Equipment
Property, plant and equipment is stated at the lower of cost or realizable value, net of accumulated depreciation.
Depreciation is computed using the straight-line method based on estimated useful lives of the assets, which
range from one to fifty years. Leasehold improvements are amortized over the lesser of estimated useful lives or
lease terms, as appropriate. Property, plant and equipment is periodically reviewed for impairment whenever
events or changes in circumstances indicate that the carrying amount of an asset may not be recoverable. We did
not recognize any significant property impairment charges in fiscal 2011, 2010 or 2009.
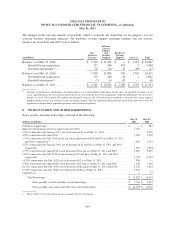
Goodwill, Intangible Assets and Impairment Assessments
Goodwill represents the excess of the purchase price in a business combination over the fair value of net tangible
and intangible assets acquired. Intangible assets that are not considered to have an indefinite useful life are
amortized over their useful lives, which generally range from one to ten years. Each period we evaluate the
estimated remaining useful life of purchased intangible assets and whether events or changes in circumstances
warrant a revision to the remaining period of amortization.
The carrying amounts of these assets are periodically reviewed for impairment (at least annually for goodwill and
indefinite lived intangible assets) and whenever events or changes in circumstances indicate that the carrying
value of these assets may not be recoverable. The goodwill impairment analysis is comprised of two steps. In the
first step, we compare the fair value of each reporting unit to its carrying value. Our reporting units are consistent
with the reportable segments identified in Note 16 below. If the fair value of the reporting unit exceeds the
carrying value of the net assets assigned to that unit, goodwill is not considered impaired and we are not required
to perform further testing. If the carrying value of the net assets assigned to the reporting unit exceeds the fair
value of the reporting unit, then we must perform the second step of the impairment test in order to determine the
implied fair value of the reporting unit’s goodwill. If the carrying value of a reporting unit’s goodwill exceeds its
implied fair value, then we would record an impairment loss equal to the difference. Recoverability of finite lived
intangible assets is measured by comparison of the carrying amount of each asset to the future undiscounted cash
flows the asset is expected to generate. Recoverability of indefinite lived intangible assets is measured by
comparison of the carrying amount of the asset to its fair value. If the asset is considered to be impaired, the
amount of any impairment is measured as the difference between the carrying value and the fair value of the
impaired asset. We did not recognize any goodwill or intangible asset impairment charges in fiscal 2011, 2010 or
2009.
Derivative Financial Instruments
During fiscal 2011, 2010 and 2009, we used derivative financial instruments to manage foreign currency and
interest rate risks. We account for these instruments in accordance with ASC 815, Derivatives and Hedging,
99