Oracle 2011 Annual Report Download - page 68
Download and view the complete annual report
Please find page 68 of the 2011 Oracle annual report below. You can navigate through the pages in the report by either clicking on the pages listed below, or by using the keyword search tool below to find specific information within the annual report.-
 1
1 -
2
-
3
-
4
-
5
-
6
-
7
-
8
-
9
-
10
-
11
-
12
-
13
-
14
-
15
-
16
-
17
-
18
-
19
-
20
-
21
-
22
-
23
-
24
-
25
-
26
-
27
-
28
-
29
-
30
-
31
-
32
-
33
-
34
-
35
-
36
-
37
-
38
-
39
-
40
-
41
-
42
-
43
-
44
-
45
-
46
-
47
-
48
-
49
-
50
-
51
-
52
-
53
-
54
-
55
-
56
-
57
-
 58
58 -
 59
59 -
 60
60 -
 61
61 -
 62
62 -
 63
63 -
 64
64 -
 65
65 -
 66
66 -
 67
67 -
 68
68 -
 69
69 -
 70
70 -
 71
71 -
 72
72 -
 73
73 -
 74
74 -
 75
75 -
 76
76 -
 77
77 -
 78
78 -
79
-
80
-
81
-
82
-
83
-
84
-
85
-
86
-
87
-
88
-
89
-
90
-
91
-
92
-
93
-
94
-
95
-
96
-
97
-
98
-
99
-
100
-
101
-
102
-
103
-
104
-
105
-
106
-
107
-
108
-
109
-
110
-
111
-
112
-
113
-
114
-
115
-
116
-
117
-
118
-
119
-
120
-
121
-
122
-
123
-
124
-
125
-
126
-
127
-
128
-
129
-
130
-
131
-
132
-
133
-
134
-
135
-
136
-
137
-
138
-
139
-
140
 |
 |

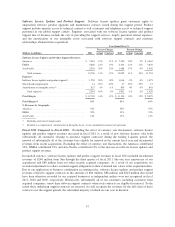
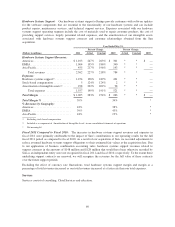
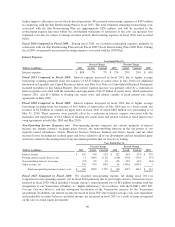
further improve efficiencies in our Oracle-based operations. We incurred restructuring expenses of $439 million
in connection with the Sun Restructuring Plan in fiscal 2011. The total estimated remaining restructuring costs
associated with the Sun Restructuring Plan are approximately $250 million, and will be recorded to the
restructuring expense line item within our consolidated statements of operations as the costs are incurred. Our
estimated costs may be subject to change in future periods. Restructuring expenses in fiscal 2010 were as noted
below.
Fiscal 2010 Compared to Fiscal 2009: During fiscal 2010, we recorded restructuring expenses primarily in
connection with our Sun Restructuring Plan and our Fiscal 2009 Oracle Restructuring Plan (2009 Plan). During
fiscal 2009, we primarily incurred restructuring expenses associated with the 2009 Plan.
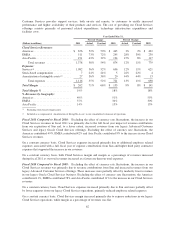
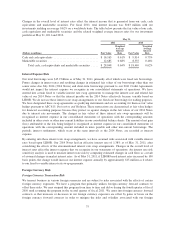
Interest Expense:
Year Ended May 31,
Percent Change Percent Change
(Dollars in millions) 2011 Actual Constant 2010 Actual Constant 2009
Interest expense ...................... $ 808 7% 7% $ 754 20% 20% $ 630
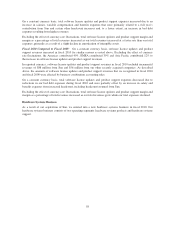
Fiscal 2011 Compared to Fiscal 2010: Interest expense increased in fiscal 2011 due to higher average
borrowings resulting primarily from our issuance of $3.25 billion of senior notes in July 2010 (see additional
discussion in Liquidity and Capital Resources below and Note 8 of Notes to Consolidated Financial Statements
included elsewhere in this Annual Report). This interest expense increase was partially offset by a reduction in
interest expense associated with the maturities and repayments of $2.25 billion of senior notes, which matured in
January 2011, and $1.0 billion of floating rate senior notes and related variable to fixed interest rate swap
agreements in May 2010.
Fiscal 2010 Compared to Fiscal 2009: Interest expense increased in fiscal 2010 due to higher average
borrowings resulting from our issuance of $4.5 billion of senior notes in July 2009 and, to a lesser extent, our
issuance of $2.8 billion of commercial paper notes in fiscal 2010 of which $881 million was outstanding as of
May 31, 2010. These increases were partially offset by a reduction in interest expense associated with the
maturities and repayments of $1.0 billion of floating rate senior notes and related variable to fixed interest rate
swap agreements in both May 2009 and May 2010.
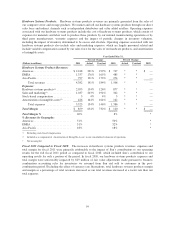
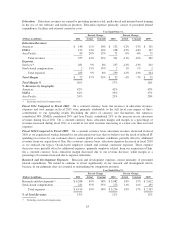
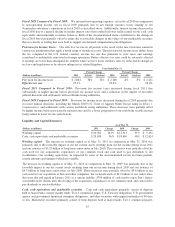
Non-Operating Income (Expense), net: Non-operating income (expense), net consists primarily of interest
income, net foreign currency exchange gains (losses), the noncontrolling interests in the net profits of our
majority-owned subsidiaries (Oracle Financial Services Software Limited and Oracle Japan), and net other
income (losses) including net realized gains and losses related to all of our investments and net unrealized gains
and losses related to the small portion of our investment portfolio that we classify as trading.
Year Ended May 31,
Percent Change Percent Change
(Dollars in millions) 2011 Actual Constant 2010 Actual Constant 2009
Interest income ............................ $ 163 34% 32% $ 122 -56% -57% $ 279
Foreign currency gains (losses), net ............ 11 108% 112% (148) -170% -170% (55)
Noncontrolling interests in income ............ (97) -2% -1% (95) -12% -11% (84)
Other income, net .......................... 109 92% 89% 56 1,192% 1,055% 3
Total non-operating income (expense), net . . . $ 186 388% 372% $ (65) -145% -144% $ 143
Fiscal 2011 Compared to Fiscal 2010: We recorded non-operating income, net during fiscal 2011 in
comparison to non-operating expense, net in fiscal 2010 primarily due to net foreign currency transaction losses
incurred in fiscal 2010, which included a foreign currency remeasurement loss of $81 million resulting from the
designation of our Venezuelan subsidiary as “highly inflationary” in accordance with the FASB’s ASC 830,
Foreign Currency Matters, and the subsequent devaluation of the Venezuelan currency by the Venezuelan
government. In addition, our interest income increased in fiscal 2011 due to larger average cash, cash equivalents
and marketable securities balances and other income, net increased in fiscal 2011 as a result of gains recognized
on the sale of certain equity investments.
66