Office Depot 2012 Annual Report Download - page 93
Download and view the complete annual report
Please find page 93 of the 2012 Office Depot annual report below. You can navigate through the pages in the report by either clicking on the pages listed below, or by using the keyword search tool below to find specific information within the annual report.-
 1
1 -
2
-
3
-
4
-
5
-
6
-
7
-
8
-
9
-
10
-
11
-
12
-
13
-
14
-
15
-
16
-
17
-
18
-
19
-
20
-
21
-
22
-
23
-
24
-
25
-
26
-
27
-
28
-
29
-
30
-
31
-
32
-
33
-
34
-
35
-
36
-
37
-
38
-
39
-
40
-
41
-
42
-
43
-
44
-
45
-
46
-
47
-
48
-
49
-
50
-
51
-
52
-
53
-
54
-
55
-
56
-
57
-
58
-
59
-
60
-
61
-
62
-
63
-
64
-
65
-
66
-
67
-
68
-
69
-
70
-
71
-
72
-
73
-
74
-
75
-
76
-
77
-
78
-
79
-
80
-
81
-
82
-
 83
83 -
 84
84 -
 85
85 -
 86
86 -
 87
87 -
 88
88 -
 89
89 -
 90
90 -
 91
91 -
 92
92 -
 93
93 -
 94
94 -
 95
95 -
 96
96 -
 97
97 -
 98
98 -
 99
99 -
 100
100 -
 101
101 -
 102
102 -
 103
103 -
104
-
105
-
106
-
107
-
108
-
109
-
110
-
111
-
112
-
113
-
114
-
115
-
116
-
117
-
118
-
119
-
120
-
121
-
122
-
123
-
124
-
125
-
126
-
127
-
128
-
129
-
130
-
131
-
132
-
133
-
134
-
135
-
136
-
137
-
138
-
139
-
140
-
141
-
142
-
143
-
144
-
145
-
146
-
147
-
148
-
149
-
150
-
151
-
152
-
153
-
154
-
155
-
156
-
157
-
158
-
159
-
160
-
161
-
162
-
163
-
164
-
165
-
166
-
167
-
168
-
169
-
170
-
171
-
172
-
173
-
174
 |
 |

OFFICE DEPOT, INC.
NOTES TO CONSOLIDATED FINANCIAL STATEMENTS (Continued)
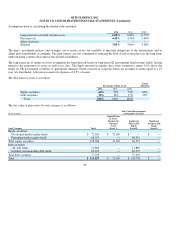
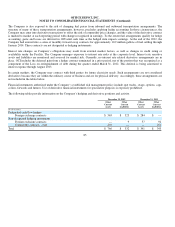
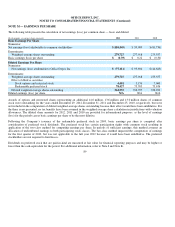
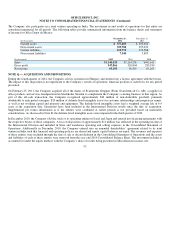
NOTE N — SUPPLEMENTAL INFORMATION ON OPERATING, INVESTING AND FINANCING ACTIVITIES
Additional supplemental information related to the Consolidated Statements of Cash Flows is as follows:
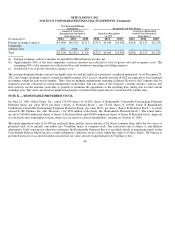
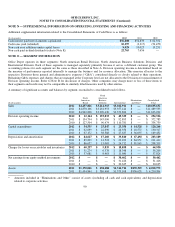
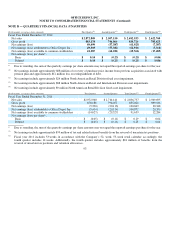
NOTE O — SEGMENT INFORMATION
Office Depot operates in three segments: North American Retail Division, North American Business Solutions Division, and
International Division. Each of these segments is managed separately primarily because it serves a different customer group. The
accounting policies for each segment are the same as those described in Note A. Division operating income is determined based on
the measure of performance reported internally to manage the business and for resource allocation. This measure allocates to the
respective Divisions those general and administrative expenses (“G&A”) considered directly or closely related to their operations.
Remaining G&A expenses and charges that are managed at the Corporate level are not allocated to the Divisions for measurement o
f
Division operating income. Refer to Note B for discussion of charges. Other companies may charge more or less of these items to
their segments and results may not be comparable to similarly titled measures used by other entities.
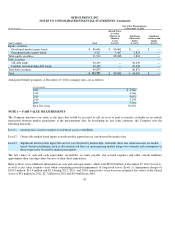
A summary of significant accounts and balances by segment, reconciled to consolidated totals follows.
90
(In thousands) 2012 2011 2010
Cash interest
p
aid (net of amounts ca
p
italized)
$56,808
$54,833
$62,352
Cash taxes
p
aid (refunded)
10,297
(3,317)
(54,459)
Non-cash asset additions under ca
p
ital leases
9,029
10,025
13,251
Non-cash
p
aid-in-kind dividends (refer to Note K)
22,765
7,656
—
(In thousands)
North
American
Retail
North
American
Business
Solutions International
Eliminations
and Other*
Consolidated
Total
Sales
201
2
$4,457,826
$3,214,915
$3,022,911
$
—
$10,695,65
2
2011
$4,870,166
$3,261,953
$3,357,414
$
—
$11,489,533
201
0
$4,962,838
$3,290,430
$3,379,826
$
—
$11,633,094
Division o
p
eratin
g
income
201
2
$ 12,164
$ 193,033
$ 49,329
$
—
$ 254,526
2011
$ 134,794
$ 145,096
$ 92,895
$
—
$ 372,785
201
0
$ 127,504
$ 96,474
$ 110,781
$
—
$ 334,759
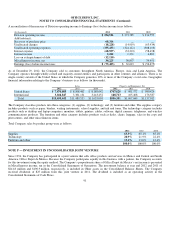
Ca
p
ital ex
p
enditures
201
2
$54,535
$25,847
$25,350
$14,528
$120,26
0
2011
$62,699
$22,690
$26,356
$18,572
$130,317
201
0
$67,172
$38,588
$27,637
$36,055
$169,452
Depreciation and amortization
201
2
$ 84,627
$ 17,260
$ 33,810
$ 67,492
$ 203,189
2011
$89,839
$14,518
$22,102
$84,951
$211,41
0
201
0
$86,657
$15,005
$24,712
$81,945
$208,319
Charges for losses on receivables and inventories
201
2
$ 40,237
$ 5,835
$ 18,858
$
—
$ 64,93
0
2011
$31,274
$6,578
$18,348
$
—
$56,20
0
201
0
$37,681
$8,463
$11,680
$
—
$57,824
Net earnings from equity method investments
201
2
$
—
$
—
$ 30,462
$
—
$ 30,46
2
2011
$
—
$
—
$ 31,426
$
—
$ 31,426
201
0
$
—
$
—
$ 30,635
$
—
$ 30,635
Assets
201
2
$1,170,046
$658,688
$1,311,716
$870,329
$4,010,779
2011
$1,434,844
$586,404
$1,373,108
$856,628
$4,250,984
* Amounts included in “Eliminations and Other” consist of assets (including all cash and cash equivalents) and depreciatio
n
related to cor
p
orate activities.