Office Depot 2012 Annual Report Download - page 36
Download and view the complete annual report
Please find page 36 of the 2012 Office Depot annual report below. You can navigate through the pages in the report by either clicking on the pages listed below, or by using the keyword search tool below to find specific information within the annual report.-
 1
1 -
2
-
3
-
4
-
5
-
6
-
7
-
8
-
9
-
10
-
11
-
12
-
13
-
14
-
15
-
16
-
17
-
18
-
19
-
20
-
21
-
22
-
23
-
24
-
25
-
 26
26 -
 27
27 -
 28
28 -
 29
29 -
 30
30 -
 31
31 -
 32
32 -
 33
33 -
 34
34 -
 35
35 -
 36
36 -
 37
37 -
 38
38 -
 39
39 -
 40
40 -
 41
41 -
 42
42 -
 43
43 -
 44
44 -
 45
45 -
 46
46 -
47
-
48
-
49
-
50
-
51
-
52
-
53
-
54
-
55
-
56
-
57
-
58
-
59
-
60
-
61
-
62
-
63
-
64
-
65
-
66
-
67
-
68
-
69
-
70
-
71
-
72
-
73
-
74
-
75
-
76
-
77
-
78
-
79
-
80
-
81
-
82
-
83
-
84
-
85
-
86
-
87
-
88
-
89
-
90
-
91
-
92
-
93
-
94
-
95
-
96
-
97
-
98
-
99
-
100
-
101
-
102
-
103
-
104
-
105
-
106
-
107
-
108
-
109
-
110
-
111
-
112
-
113
-
114
-
115
-
116
-
117
-
118
-
119
-
120
-
121
-
122
-
123
-
124
-
125
-
126
-
127
-
128
-
129
-
130
-
131
-
132
-
133
-
134
-
135
-
136
-
137
-
138
-
139
-
140
-
141
-
142
-
143
-
144
-
145
-
146
-
147
-
148
-
149
-
150
-
151
-
152
-
153
-
154
-
155
-
156
-
157
-
158
-
159
-
160
-
161
-
162
-
163
-
164
-
165
-
166
-
167
-
168
-
169
-
170
-
171
-
172
-
173
-
174
 |
 |

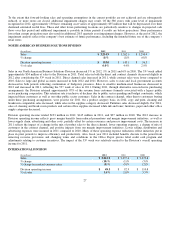
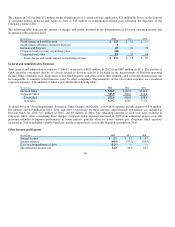
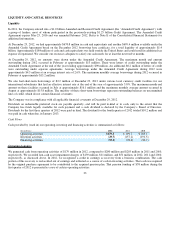
Changes in net working capital for the year-to-date 2012 resulted in a $35 million use of cash compared to $180 million use in the
same period last year. The 2011 caption includes the $66 million and $32 million non-cash accrual reversals. The decrease in
receivables, in the three years presented, reflects lower sales, improved collections, and certain changes in vendor purchase
arrangements that impacted working capital requirements. Inventory balances were lower at the end of 2012 as a result of initiatives
to better manage working capital. These sources of cash in 2012 were offset by decreases in trade accounts payable and accrued
expenses. Working capital is influenced by a number of factors, including the aging of inventory and timing of vendor payments. The
timing of payments is subject to variability during the year depending on a variety of factors, including the flow of goods, credit
terms, timing of promotions, vendor production planning, new product introductions and working capital management. For ou
r
accounting policy on cash management, refer to Note A of the Consolidated Financial Statements.
During 2011, we received a $25 million dividend from our joint venture in Mexico, Office Depot de Mexico. No dividends were
received in 2012.
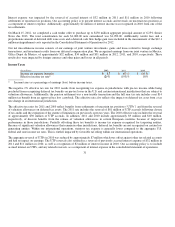
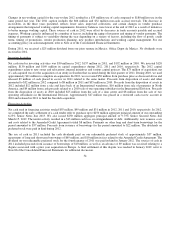
Investing Activities
Net cash used in investing activities was $30 million in 2012, $157 million in 2011, and $192 million in 2010. We invested $120
million, $130 million and $169 million in capital expenditures during 2012, 2011 and 2010, respectively. The 2012 capital
expenditures relate to new stores and relocations, internal initiatives and various capital projects. The $73 million of acquisition, net
of cash acquired was for the acquisition of an entity in Sweden that occurred during the first quarter of 2011. During 2010, we used
approximately $11 million to complete an acquisition. In 2012, we recovered $50 million from purchase price as discussed above and
released $9 million of cash placed in escrow in 2011 related to the same matter. Proceeds from disposition of assets and othe
r
amounted to $32 million in 2012 compared to $8 million in 2011 and $35 million in 2010. Proceeds from the disposition of assets in
2012 included $12 million from a sale and lease back of an International warehouse, $10 million from sale of properties in North
America, and $9 million from cash proceeds related to a 2010 sale of one operating subsidiary in the International Division. Proceeds
from the disposition of assets in 2010 included $25 million from the sale of a data center and $8 million from the sale of two
operating subsidiaries in the International Division. Approximately $47 million was placed in a restricted cash escrow account in
2010 and released in 2011 to fund the Swedish acquisition.
Financing Activities
Net cash used in financing activities totaled $55 million, $99 million and $31 million in 2012, 2011 and 2010, respectively. In 2012,
we completed the early settlement of a cash tender offer to purchase up to $250 million aggregate principal amount of our outstanding
6.25% Senior Notes due 2013. We also issued $250 million aggregate principal amount of 9.75% Senior Secured Notes due
March 15, 2019. The tender activity resulted in a $13 million cash loss on extinguishment of debt. Additionally, new issuance costs
and costs related to the Amended Credit Agreement totaled $8 million. Payments on other long and short-term borrowings for the
period amounted to $57 million. Proceeds from issuance of borrowings for the period amounted to $22 million. The dividends on
preferred stock were paid in kind during 2012.
The use of cash in 2011 included the cash dividends paid on our redeemable preferred stock of approximately $37 million,
repayments of long and short term borrowings of $69 million, and $10 million in fees related to the Amended Credit Agreement. The
dividend on our redeemable preferred stock for the fourth quarter of 2011 was paid in-kind in January 2012. The sources of cash in
2011 included proceeds from issuance of borrowings of $10 million, as well as an advance of $9 million was received relating to
a
dispute associated with a prior year acquisition in Europe. A final settlement of this dispute was reached in January 2012; refer to
Note H of the Consolidated Financial Statements for additional discussion.
34