Office Depot 2012 Annual Report Download - page 6
Download and view the complete annual report
Please find page 6 of the 2012 Office Depot annual report below. You can navigate through the pages in the report by either clicking on the pages listed below, or by using the keyword search tool below to find specific information within the annual report.-
 1
1 -
 2
2 -
 3
3 -
 4
4 -
 5
5 -
 6
6 -
 7
7 -
 8
8 -
 9
9 -
 10
10 -
 11
11 -
 12
12 -
 13
13 -
 14
14 -
 15
15 -
 16
16 -
 17
17 -
18
-
19
-
20
-
21
-
22
-
23
-
24
-
25
-
26
-
27
-
28
-
29
-
30
-
31
-
32
-
33
-
34
-
35
-
36
-
37
-
38
-
39
-
40
-
41
-
42
-
43
-
44
-
45
-
46
-
47
-
48
-
49
-
50
-
51
-
52
-
53
-
54
-
55
-
56
-
57
-
58
-
59
-
60
-
61
-
62
-
63
-
64
-
65
-
66
-
67
-
68
-
69
-
70
-
71
-
72
-
73
-
74
-
75
-
76
-
77
-
78
-
79
-
80
-
81
-
82
-
83
-
84
-
85
-
86
-
87
-
88
-
89
-
90
-
91
-
92
-
93
-
94
-
95
-
96
-
97
-
98
-
99
-
100
-
101
-
102
-
103
-
104
-
105
-
106
-
107
-
108
-
109
-
110
-
111
-
112
-
113
-
114
-
115
-
116
-
117
-
118
-
119
-
120
-
121
-
122
-
123
-
124
-
125
-
126
-
127
-
128
-
129
-
130
-
131
-
132
-
133
-
134
-
135
-
136
-
137
-
138
-
139
-
140
-
141
-
142
-
143
-
144
-
145
-
146
-
147
-
148
-
149
-
150
-
151
-
152
-
153
-
154
-
155
-
156
-
157
-
158
-
159
-
160
-
161
-
162
-
163
-
164
-
165
-
166
-
167
-
168
-
169
-
170
-
171
-
172
-
173
-
174
 |
 |

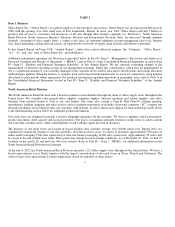
Since 1994, we have participated in a joint venture selling office products and services in Mexico and Central and South America. In
recent years, this venture, Office Depot de Mexico, has grown in size and scope and now includes 248 retail locations in Mexico,
Colombia, Costa Rica, El Salvador, Guatemala, Honduras, and Panama, as well as call centers and DCs to support the delivery
business in certain areas. Since we participate equally in this business with a partner, we account for the activity under the equity
method and venture sales of approximately $1.1 billion in 2012 are neither reflected in our revenues nor in our consolidated retail
comparable store statistics. Our portion of joint venture results is included in Miscellaneous income, net in the Consolidated
Statements of Operations.
During 2010, we entered into an amended shareholders’ agreement related to our venture in India such that control and ownership
became equally shared. Accordingly, we deconsolidated the assets and liabilities of this entity from the 2010 year end balance sheet
and account for this investment under the equity method.
The International Division has separate regional headquarters for Europe in The Netherlands and for Asia in Hong Kong.
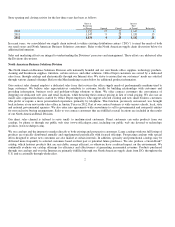
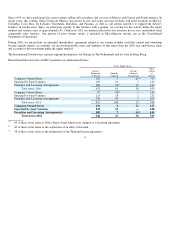
International Division store and DC operations are summarized below:
4
Office Su
pp
l
y
Stores
Open at
Beginning
of Period
Opened/
Acquired
Closed/
Changed
Designation
Open
at En
d
of
Period
Company-Owned Stores
137
7
47
97
O
p
erated b
y
Joint Ventures
195
21 1
215
Franchise and Licensin
g
Arran
g
ements
100
53 10
143
Total stores 2010
432
81
58
455
Com
p
an
y
-Owned Stores
97
43
9
131
O
p
erated b
y
Joint Ventures
215
18
1
232
Franchise and Licensin
g
Arran
g
ements
143
45
5
183
Total stores 2011
455
106
15
546
Company-Owned Stores
131
4
12
123
Operated by Joint Ventures
232
16
—
248
Franchise and Licensing Arrangements
183
7
44
146
Total stores 2012
546
2
7
56
51
7
45 of these stores relate to Office De
p
ot Israel which were chan
g
ed to a licensin
g
a
g
reement.
40 of these stores relate to the ac
q
uisition of an entit
y
in Sweden.
38 of these stores relate to the termination of the Thailand license a
g
reement.
(1)
(1)
(2)
(3)
(1)
(2)
(3)