Office Depot 2012 Annual Report Download - page 154
Download and view the complete annual report
Please find page 154 of the 2012 Office Depot annual report below. You can navigate through the pages in the report by either clicking on the pages listed below, or by using the keyword search tool below to find specific information within the annual report.-
 1
1 -
2
-
3
-
4
-
5
-
6
-
7
-
8
-
9
-
10
-
11
-
12
-
13
-
14
-
15
-
16
-
17
-
18
-
19
-
20
-
21
-
22
-
23
-
24
-
25
-
26
-
27
-
28
-
29
-
30
-
31
-
32
-
33
-
34
-
35
-
36
-
37
-
38
-
39
-
40
-
41
-
42
-
43
-
44
-
45
-
46
-
47
-
48
-
49
-
50
-
51
-
52
-
53
-
54
-
55
-
56
-
57
-
58
-
59
-
60
-
61
-
62
-
63
-
64
-
65
-
66
-
67
-
68
-
69
-
70
-
71
-
72
-
73
-
74
-
75
-
76
-
77
-
78
-
79
-
80
-
81
-
82
-
83
-
84
-
85
-
86
-
87
-
88
-
89
-
90
-
91
-
92
-
93
-
94
-
95
-
96
-
97
-
98
-
99
-
100
-
101
-
102
-
103
-
104
-
105
-
106
-
107
-
108
-
109
-
110
-
111
-
112
-
113
-
114
-
115
-
116
-
117
-
118
-
119
-
120
-
121
-
122
-
123
-
124
-
125
-
126
-
127
-
128
-
129
-
130
-
131
-
132
-
133
-
134
-
135
-
136
-
137
-
138
-
139
-
140
-
141
-
142
-
143
-
 144
144 -
 145
145 -
 146
146 -
 147
147 -
 148
148 -
 149
149 -
 150
150 -
 151
151 -
 152
152 -
 153
153 -
 154
154 -
 155
155 -
 156
156 -
 157
157 -
 158
158 -
 159
159 -
 160
160 -
 161
161 -
 162
162 -
 163
163 -
 164
164 -
165
-
166
-
167
-
168
-
169
-
170
-
171
-
172
-
173
-
174
 |
 |

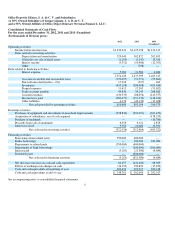
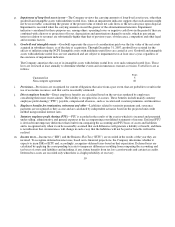
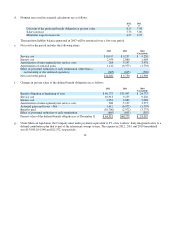
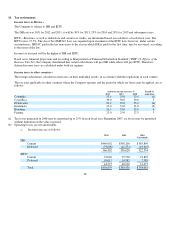
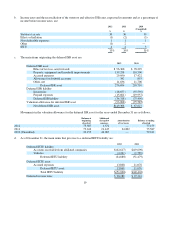
Movements in the allowance for obsolete inventories for the years ended December 31 are as follows:
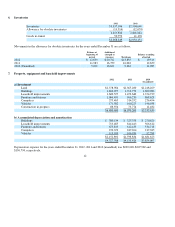
Depreciation expense for the years ended December 31, 2012, 2011 and 2010 (unaudited) was $230,248, $207,982 and
$196,794, respectively.
12
6. Inventories
2012 2011
Inventories
$3,337,106
$2,904,640
Allowance for obsolete inventories
(19,516)
(12,659)
3,317,59
0
2,891,981
Goods in-transit
50,759
41,170
$3,368,349
$2,933,151
Balance at
beginning o
f
period
Additional
charged to
expenses Shrinkage
Balance at ending
of period
2012
$12,659
$20,712
$13,855
$19,516
2011
11,983
16,759
16,083
12,659
2010 (Unaudited)
5,022
16,622
9,661
11,983
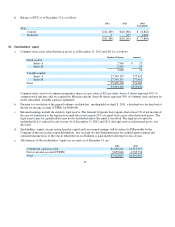
7. Property, equipment and leasehold improvements
2012 2011 2010
(Unaudited)
a) Investment
Land
$1,378,984
$1,365,260
$1,248,269
Buildin
g
s
1,803,077
1,713,779
1,609,98
0
Leasehold im
p
rovements
1,600,527
1,476,640
1,374,739
Furniture and fixtures
1,064,491
966,23
0
868,628
Com
p
uters
375,465
314,352
276,494
Vehicles
171,582
160,225
146,038
Construction in-
p
ro
g
ress
86,554
73,774
11,482
$6,480,680
$6,070,260
$5,535,63
0
b) Accumulated depreciation and amortization
Buildin
g
s
$380,134
$325,758
$270,62
0
Leasehold im
p
rovements
713,485
644,443
566,612
Furniture and fixtures
675,835
612,433
534,718
Com
p
uters
270,329
247,264
217,385
Vehicles
113,109
106,936
92,288
$2,152,892
$1,936,834
$1,681,623
$4,327,788
$4,133,426
$3,854,007