Office Depot 2012 Annual Report Download - page 35
Download and view the complete annual report
Please find page 35 of the 2012 Office Depot annual report below. You can navigate through the pages in the report by either clicking on the pages listed below, or by using the keyword search tool below to find specific information within the annual report.-
 1
1 -
2
-
3
-
4
-
5
-
6
-
7
-
8
-
9
-
10
-
11
-
12
-
13
-
14
-
15
-
16
-
17
-
18
-
19
-
20
-
21
-
22
-
23
-
24
-
 25
25 -
 26
26 -
 27
27 -
 28
28 -
 29
29 -
 30
30 -
 31
31 -
 32
32 -
 33
33 -
 34
34 -
 35
35 -
 36
36 -
 37
37 -
 38
38 -
 39
39 -
 40
40 -
 41
41 -
 42
42 -
 43
43 -
 44
44 -
 45
45 -
46
-
47
-
48
-
49
-
50
-
51
-
52
-
53
-
54
-
55
-
56
-
57
-
58
-
59
-
60
-
61
-
62
-
63
-
64
-
65
-
66
-
67
-
68
-
69
-
70
-
71
-
72
-
73
-
74
-
75
-
76
-
77
-
78
-
79
-
80
-
81
-
82
-
83
-
84
-
85
-
86
-
87
-
88
-
89
-
90
-
91
-
92
-
93
-
94
-
95
-
96
-
97
-
98
-
99
-
100
-
101
-
102
-
103
-
104
-
105
-
106
-
107
-
108
-
109
-
110
-
111
-
112
-
113
-
114
-
115
-
116
-
117
-
118
-
119
-
120
-
121
-
122
-
123
-
124
-
125
-
126
-
127
-
128
-
129
-
130
-
131
-
132
-
133
-
134
-
135
-
136
-
137
-
138
-
139
-
140
-
141
-
142
-
143
-
144
-
145
-
146
-
147
-
148
-
149
-
150
-
151
-
152
-
153
-
154
-
155
-
156
-
157
-
158
-
159
-
160
-
161
-
162
-
163
-
164
-
165
-
166
-
167
-
168
-
169
-
170
-
171
-
172
-
173
-
174
 |
 |

LIQUIDITY AND CAPITAL RESOURCES
Liquidity
In 2011, the Company entered into a $1.0 billion Amended and Restated Credit Agreement (the “Amended Credit Agreement”) with
a group of lenders, most of whom participated in the previously-existing $1.25 billion Credit Agreement. The Amended Credit
Agreement expires May 25, 2016 and was amended February 2012. Refer to Note E of the Consolidated Financial Statements fo
r
additional information.
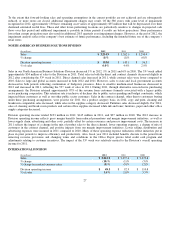
At December 29, 2012, we had approximately $670.8 million in cash and equivalents and another $699.4 million available under the
Amended Credit Agreement based on the December 2012 borrowing base certificate, for a total liquidity of approximately $1.4
billion. Approximately $184 million of cash and cash equivalents was held outside the United States and could result in additional tax
expense if repatriated. We consider our resources adequate to satisfy our cash needs for at least the next twelve months.
At December 29, 2012, no amounts were drawn under the Amended Credit Agreement. The maximum month end amount
outstanding during 2012 occurred in February at approximately $13 million. There were letters of credit outstanding under the
Amended Credit Agreement at the end of the year totaling approximately $90 million. An additional $0.2 million of letters of credit
were outstanding under separate agreements. Average borrowings under the Amended Credit Agreement during 2012 were
approximately $4.3 million at an average interest rate of 2.6%. The maximum monthly average borrowings during 2012 occurred in
February at approximately $13.2 million.
We also had short-term borrowings of $2.2 million at December 29, 2012 under various local currency credit facilities for ou
r
international subsidiaries that had an effective interest rate at the end of the year of approximately 5.8%. The maximum month end
amount on these facilities occurred in July at approximately $16.1 million and the maximum monthly average amount occurred in
August at approximately $15.8 million. The majority of these short-term borrowings represent outstanding balances on uncommitted
lines of credit, which do not contain financial covenants.
The Company was in compliance with all applicable financial covenants at December 29, 2012.
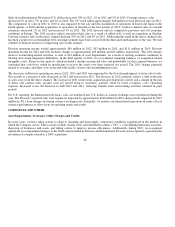
Dividends on redeemable preferred stock are payable quarterly, and will be paid in-kind or in cash, only to the extent that the
Company has funds legally available for such payment and a cash dividend is declared by the Company’s Board of Directors.
Dividends for the first three quarters of 2012 were paid-in kind. The dividend for the fourth quarter of 2012 totaled $10.2 million and
was paid in cash when due, in January 2013.
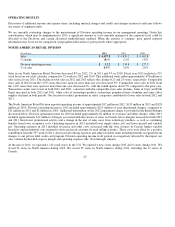
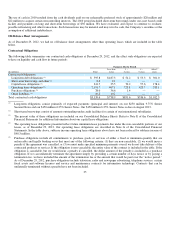
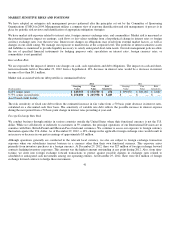
Cash Flows
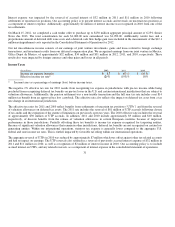
Cash provided by (used in) our operating, investing and financing activities is summarized as follows:
Operating Activities
We generated cash from operating activities of $179 million in 2012, compared to $200 million and $203 million in 2011 and 2010,
respectively. We recorded non-cash asset impairment charges of $139 million, $11 million, and $51 million, in 2012, 2011 and 2010,
respectively, as discussed above. In 2012, we recognized a credit in earnings as recovery from a business combination. The cash
portion of this recovery is reclassified out of earnings and reflected as a source of cash in investing activities. That cash was required
by the original purchase agreement to be contributed to the acquired pension plan. That pension funding of $58 million during the
first quarter of 2012 is presented as a use of cash in operating activities.
33
(In millions) 2012 2011 2010
O
p
eratin
g
activities
$179.3
$199.7
$203.1
Investin
g
activities
(29.7)
(157.2)
(191.5)
Financin
g
activities
(55.2)
(98.6)
(30.9)