Office Depot 2012 Annual Report Download - page 87
Download and view the complete annual report
Please find page 87 of the 2012 Office Depot annual report below. You can navigate through the pages in the report by either clicking on the pages listed below, or by using the keyword search tool below to find specific information within the annual report.-
 1
1 -
2
-
3
-
4
-
5
-
6
-
7
-
8
-
9
-
10
-
11
-
12
-
13
-
14
-
15
-
16
-
17
-
18
-
19
-
20
-
21
-
22
-
23
-
24
-
25
-
26
-
27
-
28
-
29
-
30
-
31
-
32
-
33
-
34
-
35
-
36
-
37
-
38
-
39
-
40
-
41
-
42
-
43
-
44
-
45
-
46
-
47
-
48
-
49
-
50
-
51
-
52
-
53
-
54
-
55
-
56
-
57
-
58
-
59
-
60
-
61
-
62
-
63
-
64
-
65
-
66
-
67
-
68
-
69
-
70
-
71
-
72
-
73
-
74
-
75
-
76
-
 77
77 -
 78
78 -
 79
79 -
 80
80 -
 81
81 -
 82
82 -
 83
83 -
 84
84 -
 85
85 -
 86
86 -
 87
87 -
 88
88 -
 89
89 -
 90
90 -
 91
91 -
 92
92 -
 93
93 -
 94
94 -
 95
95 -
 96
96 -
 97
97 -
98
-
99
-
100
-
101
-
102
-
103
-
104
-
105
-
106
-
107
-
108
-
109
-
110
-
111
-
112
-
113
-
114
-
115
-
116
-
117
-
118
-
119
-
120
-
121
-
122
-
123
-
124
-
125
-
126
-
127
-
128
-
129
-
130
-
131
-
132
-
133
-
134
-
135
-
136
-
137
-
138
-
139
-
140
-
141
-
142
-
143
-
144
-
145
-
146
-
147
-
148
-
149
-
150
-
151
-
152
-
153
-
154
-
155
-
156
-
157
-
158
-
159
-
160
-
161
-
162
-
163
-
164
-
165
-
166
-
167
-
168
-
169
-
170
-
171
-
172
-
173
-
174
 |
 |

OFFICE DEPOT, INC.
NOTES TO CONSOLIDATED FINANCIAL STATEMENTS (Continued)
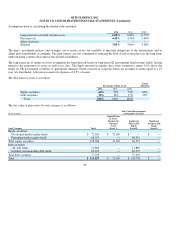
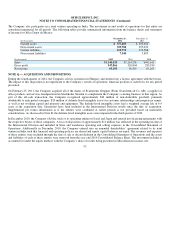
Dividends were paid in cash for each of the quarterly periods of 2010, the first three quarters of 2011, and the fourth quarter of 2012.
For the 2011 dividends paid-in-kind, the simulation was based stock price volatility of 70%, a risk free rate of 1.49%, and a ris
k
adjusted rate of 14.6%. The fair value calculation of $7.7 million was approximately $1.6 million below the amount added to the
liquidation preference. For dividends paid-in-kind for the three quarters of 2012, the average stock price volatility was 63%, the ris
k
free rate was 3.0% and the risk adjusted rate was 14.5%. The aggregate fair value calculated for these three quarters was $22.8
million, $6.3 million below the amount added to the liquidation preference. For the dividend paid-in-kind for the third quarter o
f
2012, a stock price volatility of 55% or 75% would have increased the estimate by $0.7 million or decreased the estimate by $0.6
million, respectively. Using a beginning of period stock price of $1.50 or $3.50 would have decreased the estimate by $1.7 million o
r
increased the estimate by $1.1 million, respectively. Assuming that all future dividends would be paid in cash would have increased
the estimate by $1.3 million. Assuming all future dividends would be paid-in-kind had no significant impact.
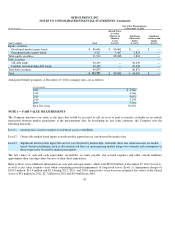
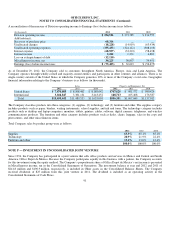
Indefinite Lived Intangible Assets
The quantitative tests of indefinite lived intangible assets during 2012 were based on a combination of discounted cash flows and
market-based information, where available. Goodwill of $45 million included in the International Division is in a reporting unit
comprised of wholly-owned operating subsidiaries in Europe and ownership of the joint venture operating in Mexico. The assessment
of fair value of the operating subsidiaries was primarily based on a discounted cash flow analysis, including an estimated residual
value. The analysis is prepared by the Company’s finance and accounting personnel that organizationally report to the Chief Financial
Officer. The cash flows were projected to decrease, level and then trend positive, with an ending year growth rate of 1.5%. These
amounts were discounted at 13%. Market data was used to corroborate this estimated value. Market data was used to estimate the
value of the joint venture and was corroborated with a discounted cash flow analysis. The total estimated fair value of the reporting
unit exceeded its carrying value by approximately 30%, with a substantial majority of the value associated with the joint venture. I
f
the joint venture were removed from the composition of the reporting unit, it is likely that all of the existing goodwill would be
impaired. Additionally, even if there is no change in the composition of the reporting unit, if future performance is below ou
r
projections, goodwill and other intangible asset impairment charges can result. The goodwill included in the North American
Business Services Division was also assessed with no indications of impairment identified.
The estimated value of the indefinite lived tradename included in the International Division was based on an estimated royalty rate o
f
0.5% applied to projected sales and discounted at 13%. No indications of impairment were identified.
There were no significant differences between the carrying values and fair values of the Company’s financial instruments as o
f
December 29, 2012 and December 31, 2011, except as disclosed above.
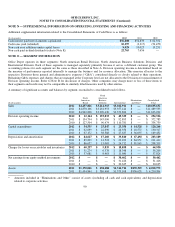
NOTE J — DERIVATIVE INSTRUMENTS AND HEDGING
As a global supplier of office products and services the Company is exposed to risks associated with changes in foreign currency
exchange rates, commodity prices and interest rates. Foreign operations are typically, but not exclusively, conducted in the currency
of the local environment. The Company is exposed to the risk of foreign currency exchange rate changes when making purchases,
selling products, or arranging financings that are denominated in a currency different from the entity’s functional currency.
Depending on the settlement timeframe and other factors, the Company may enter into foreign currency derivative transactions to
mitigate those risks. The Company may designate and account for such qualifying arrangements as hedges. Gains and losses on these
cash flow hedging transactions are deferred in other comprehensive income (“OCI”) and recognized in earnings in the same period as
the hedged item. Transactions that are not designated as cash flow hedges are marked to market at each period with changes in value
included in earnings. Historically, the Company has not entered into transactions to hedge net investment in foreign operations but
may in future periods.
84