Office Depot 2012 Annual Report Download - page 147
Download and view the complete annual report
Please find page 147 of the 2012 Office Depot annual report below. You can navigate through the pages in the report by either clicking on the pages listed below, or by using the keyword search tool below to find specific information within the annual report.-
 1
1 -
2
-
3
-
4
-
5
-
6
-
7
-
8
-
9
-
10
-
11
-
12
-
13
-
14
-
15
-
16
-
17
-
18
-
19
-
20
-
21
-
22
-
23
-
24
-
25
-
26
-
27
-
28
-
29
-
30
-
31
-
32
-
33
-
34
-
35
-
36
-
37
-
38
-
39
-
40
-
41
-
42
-
43
-
44
-
45
-
46
-
47
-
48
-
49
-
50
-
51
-
52
-
53
-
54
-
55
-
56
-
57
-
58
-
59
-
60
-
61
-
62
-
63
-
64
-
65
-
66
-
67
-
68
-
69
-
70
-
71
-
72
-
73
-
74
-
75
-
76
-
77
-
78
-
79
-
80
-
81
-
82
-
83
-
84
-
85
-
86
-
87
-
88
-
89
-
90
-
91
-
92
-
93
-
94
-
95
-
96
-
97
-
98
-
99
-
100
-
101
-
102
-
103
-
104
-
105
-
106
-
107
-
108
-
109
-
110
-
111
-
112
-
113
-
114
-
115
-
116
-
117
-
118
-
119
-
120
-
121
-
122
-
123
-
124
-
125
-
126
-
127
-
128
-
129
-
130
-
131
-
132
-
133
-
134
-
135
-
136
-
 137
137 -
 138
138 -
 139
139 -
 140
140 -
 141
141 -
 142
142 -
 143
143 -
 144
144 -
 145
145 -
 146
146 -
 147
147 -
 148
148 -
 149
149 -
 150
150 -
 151
151 -
 152
152 -
 153
153 -
 154
154 -
 155
155 -
 156
156 -
 157
157 -
158
-
159
-
160
-
161
-
162
-
163
-
164
-
165
-
166
-
167
-
168
-
169
-
170
-
171
-
172
-
173
-
174
 |
 |

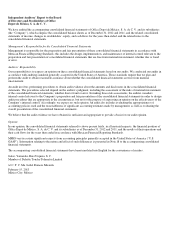
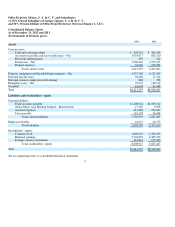
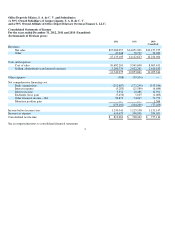
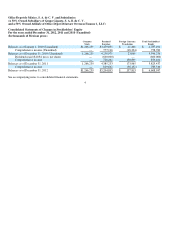
Office Depot de México, S. A. de C. V. and Subsidiaries
(A 50% Owned Subsidiary of Grupo Gigante, S. A. B. de C. V.
and a 50% Owned Affiliate of Office Depot Delaware Overseas Finance 1, LLC)
Consolidated Statements of Cash Flows
For the years ended December 31, 2012, 2011 and 2010 (Unaudited)
(In thousands of Mexican pesos)
See accompanying notes to consolidated financial statements.
5
2012 2011 2010
(Unaudited)
O
p
eratin
g
activities:
Income before income taxes
$1,230,341
$1,125,198
$1,131,147
Items related to investin
g
activities:
De
p
reciation and amortization
329,049
302,872
262,653
(Gain) loss on sale of fixed assets
(1,195)
(1,147)
15,520
Interest income
(9,352)
(10,486)
(12,391)
Other
—
(708)
—
Items related to financin
g
activities:
Interest ex
p
ense
5,283
21,580
6,684
1,554,126
1,437,309
1,403,613
Accounts receivable and recoverable taxes
(170,697)
(51,571)
(95,802)
Due to/from related
p
arties
–
Net
17,226
(527)
463
Inventories
(435,198)
(204,088)
(495,636)
Pre
p
aid ex
p
enses
11,415
17,365
(51,692)
Trade accounts
p
a
y
able
49,430
54,145
208,820
Accrued ex
p
enses
(130,535)
(88,054)
(143,557)
Income taxes
p
aid
(289,477)
(251,339)
(218,166)
Other liabilities
4,176
(20,136)
(17,468)
Net cash
p
rovided b
y
o
p
eratin
g
activities
610,466
893,104
590,575
Investin
g
activities:
Purchases of e
q
ui
p
ment and investments in leasehold im
p
rovements
(538,834)
(529,491)
(321,450)
Ac
q
uisition of subsidiaries, net of cash ac
q
uired
—
—
(178,353)
Purchase of trademar
k
—
—
(10,786)
Proceeds from sale of e
q
ui
p
ment
6,556
6,321
2,876
Interest received
9,352
10,486
12,391
Net cash used in investin
g
activities
(522,926)
(512,684)
(495,322)
Financin
g
activities:
Borrowin
g
s from related
p
art
y
550,000
400,000
—
Banks borrowin
g
s
—
100,000
100,000
Re
p
a
y
ments to related
p
art
y
(550,000)
(400,000)
—
Re
p
a
y
ments of bank borrowin
g
s
—
(100,000)
(100,000)
Interest
p
aid
(5,283)
(21,580)
(6,684)
Dividends
p
aid
—
(600,000)
—
Net cash used in financin
g
activities
(5,283)
(621,580)
(6,684)
Net (decrease) increase in cash and cash e
q
uivalents
82,257
(241,160)
88,569
Effects of exchan
g
e rate chan
g
es on cash
(36,152)
150,899
(17,870)
Cash and cash e
q
uivalents at be
g
innin
g
of
y
ear
302,656
392,917
322,218
Cash and cash equivalents at end of year
$ 348,761
$ 302,656
$ 392,917