Office Depot 2012 Annual Report Download - page 26
Download and view the complete annual report
Please find page 26 of the 2012 Office Depot annual report below. You can navigate through the pages in the report by either clicking on the pages listed below, or by using the keyword search tool below to find specific information within the annual report.-
 1
1 -
2
-
3
-
4
-
5
-
6
-
7
-
8
-
9
-
10
-
11
-
12
-
13
-
14
-
15
-
 16
16 -
 17
17 -
 18
18 -
 19
19 -
 20
20 -
 21
21 -
 22
22 -
 23
23 -
 24
24 -
 25
25 -
 26
26 -
 27
27 -
 28
28 -
 29
29 -
 30
30 -
 31
31 -
 32
32 -
 33
33 -
 34
34 -
 35
35 -
 36
36 -
37
-
38
-
39
-
40
-
41
-
42
-
43
-
44
-
45
-
46
-
47
-
48
-
49
-
50
-
51
-
52
-
53
-
54
-
55
-
56
-
57
-
58
-
59
-
60
-
61
-
62
-
63
-
64
-
65
-
66
-
67
-
68
-
69
-
70
-
71
-
72
-
73
-
74
-
75
-
76
-
77
-
78
-
79
-
80
-
81
-
82
-
83
-
84
-
85
-
86
-
87
-
88
-
89
-
90
-
91
-
92
-
93
-
94
-
95
-
96
-
97
-
98
-
99
-
100
-
101
-
102
-
103
-
104
-
105
-
106
-
107
-
108
-
109
-
110
-
111
-
112
-
113
-
114
-
115
-
116
-
117
-
118
-
119
-
120
-
121
-
122
-
123
-
124
-
125
-
126
-
127
-
128
-
129
-
130
-
131
-
132
-
133
-
134
-
135
-
136
-
137
-
138
-
139
-
140
-
141
-
142
-
143
-
144
-
145
-
146
-
147
-
148
-
149
-
150
-
151
-
152
-
153
-
154
-
155
-
156
-
157
-
158
-
159
-
160
-
161
-
162
-
163
-
164
-
165
-
166
-
167
-
168
-
169
-
170
-
171
-
172
-
173
-
174
 |
 |

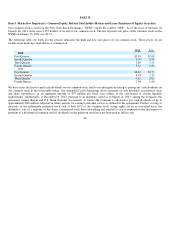
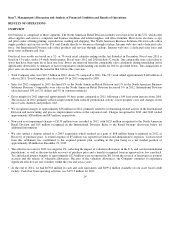
Item 7. Management’s Discussion and Analysis of Financial Condition and Results of Operations.
RESULTS OF OPERATIONS
OVERVIEW
Our business is comprised of three segments. The North American Retail Division includes our retail stores in the U.S. which offe
r
office supplies and services, computers and business machines and related supplies, and office furniture. Most stores also have a copy
and print center offering printing, reproduction, mailing and shipping. The North American Business Solutions Division sells office
supply products and services in the U.S. and Canada directly to businesses through catalogs, Internet web sites and a dedicated sales
force. Our International Division sells office products and services through catalogs, Internet web sites, a dedicated sales force and
retail stores in Europe and Asia.
Our fiscal year results are based on a 52- or 53-week retail calendar ending on the last Saturday in December. Fiscal year 2011 is
based on 53 weeks, with a 14-week fourth quarter. Fiscal years 2012 and 2010 include 52 weeks. Our comparable store sales relate to
stores that have been open for at least one year. Stores are removed from the comparable sales calculation during remodeling and i
f
significantly downsized. A summary of factors important to understanding our results for 2012 is provided below. The comparisons to
prior years are discussed in the narrative that follows this overview.
24
•
Total Company sales were $10.7 billion in 2012, down 7% compared to 2011. The 53 week added approximately $140 million o
f
sales in 2011. Total Com
p
an
y
sales decreased 1% in 2011 com
p
ared to 2010.
•
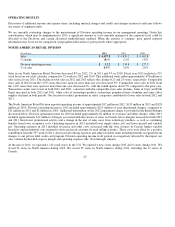
Sales for 2012 compared to 2011 declined 8% in the North American Retail Division and 1% in the North American Business
Solutions Division. Comparable store sales in the North American Retail Division decreased 5% in 2012. International Division
sales decreased 10% in U.S. dollars and 5% in constant currencies.
•
Gross margin for 2012 improved approximately 50 basis points compared to 2011, following a 100 basis point increase from 2010.
The increase in 2012 primarily reflects improvement from reduced promotional activity, lower property costs and changes in the
mix of sales channels and
p
roducts sold.
•
We recognized charges of approximately $56 million in 2012, primarily related to restructuring-related activity in the International
Division and restructuring and process improvement actions at the corporate level. Charges recognized in 2011 and 2010 totaled
a
pp
roximatel
y
$58 million and $87 million, res
p
ectivel
y
.
•
Non-cash asset impairment charges of $139 million were recorded in 2012, with $123 million recognized in the North American
Retail Division and $15 million recognized in the International Division. Refer to the Retail Strategy discussion below fo
r
additional information.
•
We also settled a dispute related to a 2003 acquisition which resulted in a gain of $68 million being recognized in 2012 as
Recovery of purchase price. A related expense of $5 million was reported in General and administrative expenses. Cash received
from this settlement was contributed to the acquired pension plan, resulting in the plan being in a net funded position o
f
a
pp
roximatel
y
$8 million at December 29, 2012.
•
The effective tax rate for 2012 was negative 2%, reflecting the impact of valuation allowances in the U.S. and certain international
j
urisdictions, as well as the non-taxable recovery of purchase price and a benefit recognized from an approved tax loss carryback.
Tax and related interest benefits of approximately $123 million were recognized in 2011 from the reversal of uncertain tax position
accruals and the release of valuation allowances. Because of the valuation allowances, the Company continues to experience
si
g
nificant effective tax rate volatilit
y
within the
y
ear and across
y
ears.
•
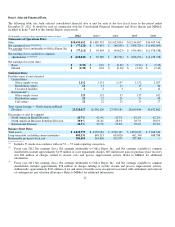
At the end of 2012, we had $670.8 million in cash and cash equivalents and $699.4 million available on our asset based credi
t
facilit
y
. Cash flow from o
p
eratin
g
activities was $179.3 million for 2012.
rd