Office Depot 2012 Annual Report Download - page 61
Download and view the complete annual report
Please find page 61 of the 2012 Office Depot annual report below. You can navigate through the pages in the report by either clicking on the pages listed below, or by using the keyword search tool below to find specific information within the annual report.-
 1
1 -
2
-
3
-
4
-
5
-
6
-
7
-
8
-
9
-
10
-
11
-
12
-
13
-
14
-
15
-
16
-
17
-
18
-
19
-
20
-
21
-
22
-
23
-
24
-
25
-
26
-
27
-
28
-
29
-
30
-
31
-
32
-
33
-
34
-
35
-
36
-
37
-
38
-
39
-
40
-
41
-
42
-
43
-
44
-
45
-
46
-
47
-
48
-
49
-
50
-
 51
51 -
 52
52 -
 53
53 -
 54
54 -
 55
55 -
 56
56 -
 57
57 -
 58
58 -
 59
59 -
 60
60 -
 61
61 -
 62
62 -
 63
63 -
 64
64 -
 65
65 -
 66
66 -
 67
67 -
 68
68 -
 69
69 -
 70
70 -
 71
71 -
72
-
73
-
74
-
75
-
76
-
77
-
78
-
79
-
80
-
81
-
82
-
83
-
84
-
85
-
86
-
87
-
88
-
89
-
90
-
91
-
92
-
93
-
94
-
95
-
96
-
97
-
98
-
99
-
100
-
101
-
102
-
103
-
104
-
105
-
106
-
107
-
108
-
109
-
110
-
111
-
112
-
113
-
114
-
115
-
116
-
117
-
118
-
119
-
120
-
121
-
122
-
123
-
124
-
125
-
126
-
127
-
128
-
129
-
130
-
131
-
132
-
133
-
134
-
135
-
136
-
137
-
138
-
139
-
140
-
141
-
142
-
143
-
144
-
145
-
146
-
147
-
148
-
149
-
150
-
151
-
152
-
153
-
154
-
155
-
156
-
157
-
158
-
159
-
160
-
161
-
162
-
163
-
164
-
165
-
166
-
167
-
168
-
169
-
170
-
171
-
172
-
173
-
174
 |
 |

OFFICE DEPOT, INC.
NOTES TO CONSOLIDATED FINANCIAL STATEMENTS (Continued)
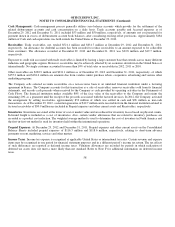
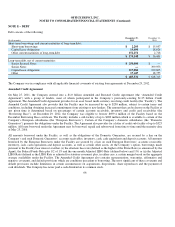
Cash Management: Cash management process generally utilizes zero balance accounts which provide for the settlement of the
related disbursement accounts and cash concentration on a daily basis. Trade accounts payable and Accrued expenses as o
f
December 29, 2012 and December 31, 2011 included $53 million and $50 million, respectively, of amounts not yet presented fo
r
payment drawn in excess of disbursement account book balances, after considering existing offset provisions. Approximately $184
million of Cash and cash equivalents was held outside the United States at December 29, 2012.
Receivables: Trade receivables, net, totaled $521.1 million and $631.7 million at December 29, 2012 and December 31, 2011,
respectively. An allowance for doubtful accounts has been recorded to reduce receivables to an amount expected to be collectible
from customers. The allowance recorded at December 29, 2012 and December 31, 2011 was $22.8 million and $19.7 million,
respectively.
Exposure to credit risk associated with trade receivables is limited by having a large customer base that extends across many different
industries and geographic regions. However, receivables may be adversely affected by an economic slowdown in the United States o
r
internationally. No single customer accounted for more than 10% of total sales or receivables in 2012, 2011 or 2010.
Other receivables are $282.9 million and $231.1 million as of December 29, 2012 and December 31, 2011, respectively, of which
$155.3 million and $181.6 million are amounts due from vendors under purchase rebate, cooperative advertising and various othe
r
marketing programs.
The Company sells selected accounts receivables on a non-recourse basis to an unrelated financial institution under a factoring
agreement in France. The Company accounts for this transaction as a sale of receivables, removes receivables sold from its financial
statements, and records cash proceeds when received by the Company as cash provided by operating activities in the Statements o
f
Cash Flows. The financial institution makes available 80% of the face value of the receivables to the Company and retains the
remaining 20% as a guarantee until the receipt of the proceeds associated with the factored invoices. In 2012, the Company activated
the arrangement by selling receivables, approximately $53 million of which was settled in cash and $96 million as non-cash
transactions. As of December 29, 2012, a retention guarantee of $12.7 million and a receivable from the financial institution related to
factored receivables of $50.9 million are included in Prepaid expenses and other current assets and Receivables, respectively.
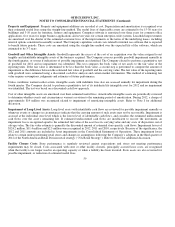
Inventories: Inventories are stated at the lower of cost or market value and are reduced for inventory losses based on physical counts.
In-bound freight is included as a cost of inventories. Also, certain vendor allowances that are related to inventory purchases are
recorded as a product cost reduction. The weighted average method is used to determine the cost of inventory in North America and
the first-in-first-out method is used for inventory held within the international operations.
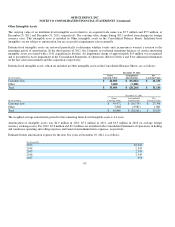
Prepaid Expenses: At December 29, 2012 and December 31, 2011, Prepaid expenses and other current assets on the Consolidated
Balance Sheets included prepaid expenses of $116.3 million and $118.6 million, respectively, relating to short-term advance
payments on rent, marketing, services and other matters.
Income Taxes: Income tax expense is recognized at applicable United States or international tax rates. Certain revenue and expense
items may be recognized in one period for financial statement purposes and in a different period’s income tax return. The tax effects
of such differences are reported as deferred income taxes. Valuation allowances are recorded for periods in which realization o
f
deferred tax assets does not meet a more likely than not standard. Refer to Note F for additional information on deferred income
taxes.
58