Office Depot 2012 Annual Report Download - page 169
Download and view the complete annual report
Please find page 169 of the 2012 Office Depot annual report below. You can navigate through the pages in the report by either clicking on the pages listed below, or by using the keyword search tool below to find specific information within the annual report.-
 1
1 -
2
-
3
-
4
-
5
-
6
-
7
-
8
-
9
-
10
-
11
-
12
-
13
-
14
-
15
-
16
-
17
-
18
-
19
-
20
-
21
-
22
-
23
-
24
-
25
-
26
-
27
-
28
-
29
-
30
-
31
-
32
-
33
-
34
-
35
-
36
-
37
-
38
-
39
-
40
-
41
-
42
-
43
-
44
-
45
-
46
-
47
-
48
-
49
-
50
-
51
-
52
-
53
-
54
-
55
-
56
-
57
-
58
-
59
-
60
-
61
-
62
-
63
-
64
-
65
-
66
-
67
-
68
-
69
-
70
-
71
-
72
-
73
-
74
-
75
-
76
-
77
-
78
-
79
-
80
-
81
-
82
-
83
-
84
-
85
-
86
-
87
-
88
-
89
-
90
-
91
-
92
-
93
-
94
-
95
-
96
-
97
-
98
-
99
-
100
-
101
-
102
-
103
-
104
-
105
-
106
-
107
-
108
-
109
-
110
-
111
-
112
-
113
-
114
-
115
-
116
-
117
-
118
-
119
-
120
-
121
-
122
-
123
-
124
-
125
-
126
-
127
-
128
-
129
-
130
-
131
-
132
-
133
-
134
-
135
-
136
-
137
-
138
-
139
-
140
-
141
-
142
-
143
-
144
-
145
-
146
-
147
-
148
-
149
-
150
-
151
-
152
-
153
-
154
-
155
-
156
-
157
-
158
-
 159
159 -
 160
160 -
 161
161 -
 162
162 -
 163
163 -
 164
164 -
 165
165 -
 166
166 -
 167
167 -
 168
168 -
 169
169 -
 170
170 -
 171
171 -
 172
172 -
 173
173 -
 174
174
 |
 |

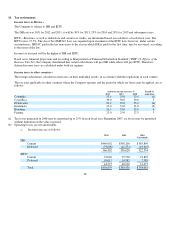
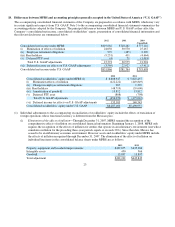
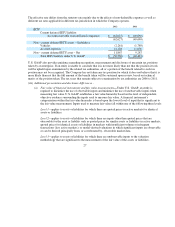
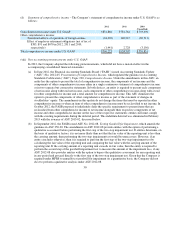
The effective rate differs from the statutory rate mainly due to the effects of non-deductible expenses as well as
different tax rates applicable in different tax jurisdiction in which the Company operates.
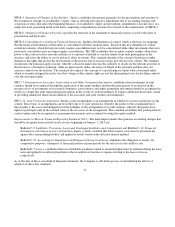
U.S. GAAP also provides guidance regarding recognition, measurement and disclosure of uncertain tax positions
taken by an enterprise. If an entity is unable to conclude that it is not more likely than not that the position it took
will be upheld upon examination by the related tax authorities, all or a portion of the benefit related to such tax
position may not be recognized. The Company has not taken any tax position for which it does not believe that it is
more likely than not that the full amount of the benefit taken will be sustained upon review, based on technical
merits of the position taken. The tax years that remain subject to examination by tax authorities are 2006 to 2011.
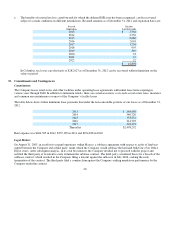
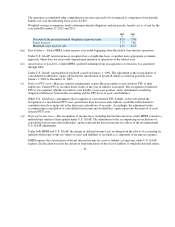
Level 1—applies to assets or liabilities for which there are quoted prices in active markets for identical
assets or liabilities.
Level 2—applies to assets or liabilities for which there are inputs other than quoted prices that are
observable for the asset or liability such as quoted prices for similar assets or liabilities in active markets;
quoted prices for identical assets or liabilities in markets with insufficient volume or infrequent
transactions (less active markets); or model-derived valuations in which significant inputs are observable
or can be derived principally from, or corroborated by, observable market data.
Level 3—applies to assets or liabilities for which there are unobservable inputs to the valuation
methodology that are significant to the measurement of the fair value of the assets or liabilities.
27
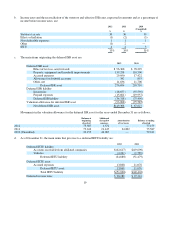
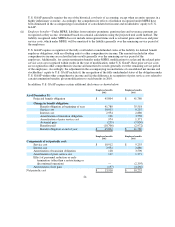
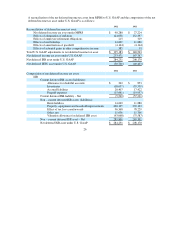
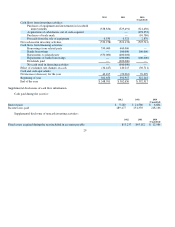
2012 2011
IETU
Current deferred IETU liabilit
y
:
Account receivable from affiliated com
p
anies
$(62,627)
$(49,690)
(62,627)
(49,690)
Non
–
current deferred IETU assets
–
(liabilities):
Vehicles
(2,261)
(1,789)
Accrued ex
p
enses
14,128
11,076
Non
–
current deferred IETU asset
–
Net
11,867
9,287
Total IETU liabilit
y
under U.S. GAAP
$(50,760)
$(40,403)
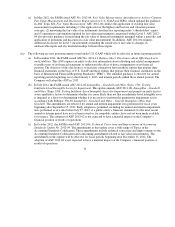
(vii)
A
dditional presentation and disclosure differences -
(a) Fair value of financial instruments and fair value measurements—Under U.S. GAAP, an entity is
required to maximize the use of observable inputs and minimize the use of unobservable inputs when
measuring fair value. U.S. GAAP establishes a fair value hierarchy based on the level of independent,
objective evidence surrounding the inputs used to measure fair value. A financial instrument’s
categorization within the fair value hierarchy is based upon the lowest level of input that is significant to
the fair value measurement. In
p
uts used to measure fair value fall within one of the followin
g
three levels: