Office Depot 2012 Annual Report Download - page 30
Download and view the complete annual report
Please find page 30 of the 2012 Office Depot annual report below. You can navigate through the pages in the report by either clicking on the pages listed below, or by using the keyword search tool below to find specific information within the annual report.-
 1
1 -
2
-
3
-
4
-
5
-
6
-
7
-
8
-
9
-
10
-
11
-
12
-
13
-
14
-
15
-
16
-
17
-
18
-
19
-
 20
20 -
 21
21 -
 22
22 -
 23
23 -
 24
24 -
 25
25 -
 26
26 -
 27
27 -
 28
28 -
 29
29 -
 30
30 -
 31
31 -
 32
32 -
 33
33 -
 34
34 -
 35
35 -
 36
36 -
 37
37 -
 38
38 -
 39
39 -
 40
40 -
41
-
42
-
43
-
44
-
45
-
46
-
47
-
48
-
49
-
50
-
51
-
52
-
53
-
54
-
55
-
56
-
57
-
58
-
59
-
60
-
61
-
62
-
63
-
64
-
65
-
66
-
67
-
68
-
69
-
70
-
71
-
72
-
73
-
74
-
75
-
76
-
77
-
78
-
79
-
80
-
81
-
82
-
83
-
84
-
85
-
86
-
87
-
88
-
89
-
90
-
91
-
92
-
93
-
94
-
95
-
96
-
97
-
98
-
99
-
100
-
101
-
102
-
103
-
104
-
105
-
106
-
107
-
108
-
109
-
110
-
111
-
112
-
113
-
114
-
115
-
116
-
117
-
118
-
119
-
120
-
121
-
122
-
123
-
124
-
125
-
126
-
127
-
128
-
129
-
130
-
131
-
132
-
133
-
134
-
135
-
136
-
137
-
138
-
139
-
140
-
141
-
142
-
143
-
144
-
145
-
146
-
147
-
148
-
149
-
150
-
151
-
152
-
153
-
154
-
155
-
156
-
157
-
158
-
159
-
160
-
161
-
162
-
163
-
164
-
165
-
166
-
167
-
168
-
169
-
170
-
171
-
172
-
173
-
174
 |
 |

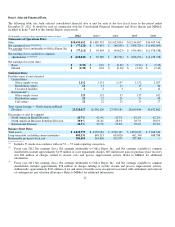
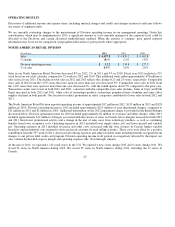
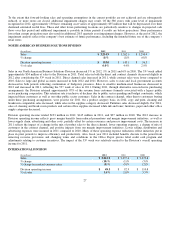
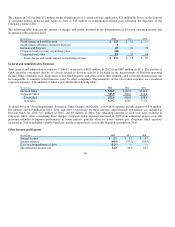
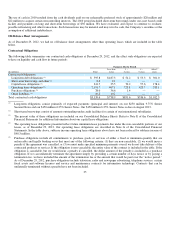
Sales in our International Division in U.S. dollars decreased 10% in 2012, 1% in 2011 and 5% in 2010. Constant currency sales
decreased 5% in 2012, 5% in 2011 and 2% in 2010. The 53 week added approximately $28 million to total Division sales in 2011.
The comparison of sales in 2011 to 2010 is also impacted by the sale and deconsolidation of operations in Israel and Japan in the
fourth quarter of 2010 and the acquisition of operations in Sweden in the first quarter of 2011. Contract channel sales in constant
currencies decreased 2% in 2012 and increased 3% in 2011. The 2012 decrease reflects competitive pressures and soft economic
conditions in Europe. The 2011 increase reflects growth in field sales as a result of added staff, as well an acquisition in Sweden.
Constant currency sales in the direct channel declined 10% in 2012 and 6% in 2011. Addressing this trend in the direct channel sales
has been a point of focus throughout 2012 and improvements have been seen in both the third and fourth quarters of the year. We will
continue to dedicate resources to improving sales in this channel.
Division operating income totaled approximately $49 million in 2012, $93 million in 2011, and $111 million in 2010. Division
operating income for 2012 and 2011 includes charges of approximately $49 million and $31 million, respectively. The 2012 charges
relate to restructuring-related activities, as well as $14 million of asset impairments. As a result of slowing economic conditions in
Sweden and certain integration difficulties, in the third quarter of 2012, we re-evaluated remaining balances of acquisition-related
intangible assets. Based on this analysis, which included a decline in projected sales and profitability for this acquired business, we
concluded that cash flows would be insufficient to recover the assets over their expected use period. The 2011 charges primarily
related to severance and other costs associated with facility closures and streamlining processes.
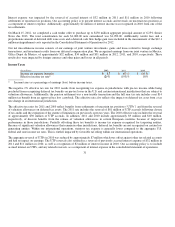
The decreases in Division operating income in 2012, 2011 and 2010 were impacted by the flow through impact of lower sales levels.
Gross profit as a percent of sales decreased in 2012 and increased in 2011. The decrease in 2012 primarily reflects a shift in the mix
of sales away from the direct channel. The increase in 2011 results from acquisition and disposition activity and a change in the mix
of direct and contract sales, product costs not passed along to customers, partially offset by lower occupancy costs. Operating
expenses decreased across the Division in both 2012 and 2011, reflecting benefits from restructuring activities initiated in prio
r
periods.
For U.S. reporting, the International Division’s sales are translated into U.S. dollars at average exchange rates experienced during the
year. The Division’s reported sales were negatively impacted by approximately $160 million in 2012 and positively impacted by $147
million in 2011 from changes in foreign currency exchange rates. Internally, we analyze our international operations in terms of local
currency performance to allow focus on operating trends and results.
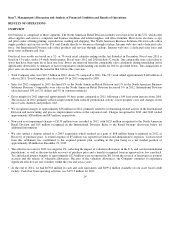
CORPORATE AND OTHER
Asset Impairments, Severance, Other Charges and Credits
In recent years, we have taken actions to adapt to changing and increasingly competitive conditions experienced in the markets in
which the Company serves. These actions include closing stores and distribution centers (“DCs”), consolidating functional activities,
disposing of businesses and assets, and taking actions to improve process efficiencies. Additionally, during 2012, we recognized
significant asset impairment charges in the North American Retail Division and International Division and recognized a gain from the
resolution of a dispute related to a 2003 acquisition.
28
r
d