Office Depot 2012 Annual Report Download - page 92
Download and view the complete annual report
Please find page 92 of the 2012 Office Depot annual report below. You can navigate through the pages in the report by either clicking on the pages listed below, or by using the keyword search tool below to find specific information within the annual report.-
 1
1 -
2
-
3
-
4
-
5
-
6
-
7
-
8
-
9
-
10
-
11
-
12
-
13
-
14
-
15
-
16
-
17
-
18
-
19
-
20
-
21
-
22
-
23
-
24
-
25
-
26
-
27
-
28
-
29
-
30
-
31
-
32
-
33
-
34
-
35
-
36
-
37
-
38
-
39
-
40
-
41
-
42
-
43
-
44
-
45
-
46
-
47
-
48
-
49
-
50
-
51
-
52
-
53
-
54
-
55
-
56
-
57
-
58
-
59
-
60
-
61
-
62
-
63
-
64
-
65
-
66
-
67
-
68
-
69
-
70
-
71
-
72
-
73
-
74
-
75
-
76
-
77
-
78
-
79
-
80
-
81
-
 82
82 -
 83
83 -
 84
84 -
 85
85 -
 86
86 -
 87
87 -
 88
88 -
 89
89 -
 90
90 -
 91
91 -
 92
92 -
 93
93 -
 94
94 -
 95
95 -
 96
96 -
 97
97 -
 98
98 -
 99
99 -
 100
100 -
 101
101 -
 102
102 -
103
-
104
-
105
-
106
-
107
-
108
-
109
-
110
-
111
-
112
-
113
-
114
-
115
-
116
-
117
-
118
-
119
-
120
-
121
-
122
-
123
-
124
-
125
-
126
-
127
-
128
-
129
-
130
-
131
-
132
-
133
-
134
-
135
-
136
-
137
-
138
-
139
-
140
-
141
-
142
-
143
-
144
-
145
-
146
-
147
-
148
-
149
-
150
-
151
-
152
-
153
-
154
-
155
-
156
-
157
-
158
-
159
-
160
-
161
-
162
-
163
-
164
-
165
-
166
-
167
-
168
-
169
-
170
-
171
-
172
-
173
-
174
 |
 |

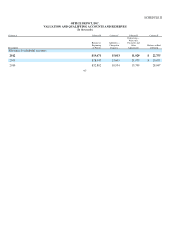
OFFICE DEPOT, INC.
NOTES TO CONSOLIDATED FINANCIAL STATEMENTS (Continued)
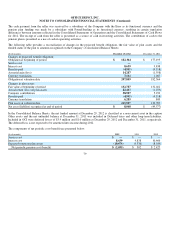
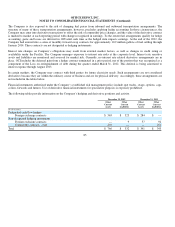
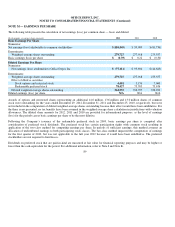
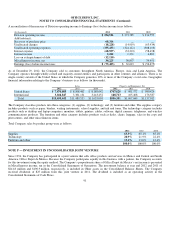
NOTE M — EARNINGS PER SHARE
The following table presents the calculation of net earnings (loss) per common share — basic and diluted:
Awards of options and nonvested shares representing an additional 14.6 million, 13.6 million and 13.0 million shares of common
stock were outstanding for the years ended December 29, 2012, December 31, 2011 and December 25, 2010, respectively, but were
not included in the computation of diluted weighted-average shares outstanding because their effect would have been antidilutive. Fo
r
the three years presented, no tax benefits have been assumed in the weighted average share calculation in jurisdictions with valuation
allowances. The diluted share amounts for 2012, 2011 and 2010 are provided for informational purposes, as the level of earnings
(loss) for the periods causes basic earnings per share to be the most dilutive.
Following the Company’s issuance of the redeemable preferred stock in 2009, basic earnings per share is computed afte
r
consideration of preferred stock dividends. The preferred stock has certain participation rights with common stock resulting in
application of the two-class method for computing earnings per share. In periods of sufficient earnings, this method assumes an
allocation of undistributed earnings to both participating stock classes. The two-class method impacted the computation of earnings
for the first quarter of 2012, but was not applicable to the full year 2012 because if would have been antidilutive. The preferred
stockholders are not required to fund losses.
Dividends on preferred stock that are paid-in-kind are measured at fair value for financial reporting purposes and may be higher o
r
lower than the cash-equivalent for the period. For additional information, refer to Note I and Note K.
89
(In thousands, exce
p
t
p
er share amounts) 2012 2011 2010
Basic Earnings Per Share
Numerator:
Net earnin
g
s (loss) attributable to common stockholders
$(110,045)
$59,989
$(81,736)
Denominator:
Wei
g
hted-avera
g
e shares outstandin
g
279,727
277,918
275,557
Basic earnin
g
s (loss)
p
er share
$(0.39)
$0.22
$(0.3
0
)
Diluted Earnings Per Share
Numerator:
Net earnin
g
s (loss) attributable to Office De
p
ot, Inc.
$(77,111)
$95,694
$(44,623)
Denominator:
Wei
g
hted-avera
g
e shares outstandin
g
279,727
277,918
275,557
Effect of dilutive securities:
Stock o
p
tions and restricted stoc
k
4,401
5,176
7,06
0
Redeemable
p
referred stoc
k
78,427
73,703
73,676
Diluted wei
g
hted-avera
g
e shares outstandin
g
362,555
356,797
356,293
Diluted earnin
g
s (loss)
p
er share
N/A
N/A
N/A